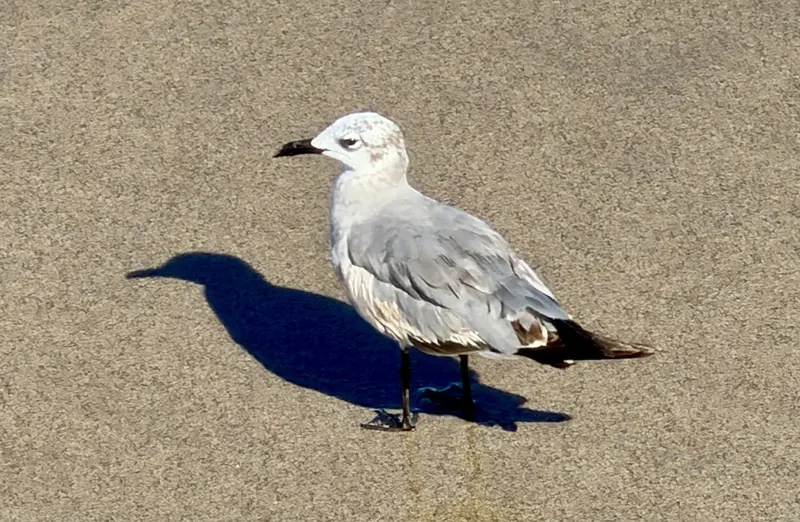
Laughing Gulls reach District of Columbia in the second week of July, are common by late July, peak in mid August (18% of checklists), and most are gone by early November.
When to look
First arrivalsJul 8-14the second week of July
Common byJul 22-31late July
PeakAug 15-21mid August
Most gone byNov 1-7early November
Best: mid August. First arrivals the second week of July; most are gone by early November. Peak: on about 18% of District of Columbia checklists.
Jannot usually seen
Febnot usually seen
Marnot usually seen
Aprnot usually seen
Maynot usually seen
Junnot usually seen
Julcommon
Augpeak season
Seppeak season
Octcommon
Novuncommon
Decrare
Darker months: more checklists report it. Outlined: peak month.
Share of complete checklists reporting it, by week (4 per month). Grey bars: fewer than 10 checklists, not counted.
Frequency is the share of complete checklists in District of Columbia that listed the bird, 2016–2025. It is not a head count, and it follows where and when people go birding. How to read it.
JanFebMarAprMayJunJulAugSepOctNovDec
today
0%few checklistsno data
Each county is shaded by the share of complete checklists there that listed the bird, blended with the weeks either side. Darker is more often. It follows where people watch birds, not how many birds there are. How to read it.
Heritage IslandDistrict of Columbia County, best late August · 102 checklists that week, 3,356 in all53%
Busy spots report more of everything; compare the checklist counts before you drive anywhere.
Best time of day
In District of Columbia, the Laughing Gull is most often listed on checklists started between 6 and 8 am (5.5% of those checklists).
Share of checklists started in each local hour that reported it. It reflects when people go birding as well as when birds are active. Grey hours have too few checklists (under 2% of the state’s, or under 200) to judge.Week-by-week table
Month
Days 1-7
8-14
15-21
22-end
January
0.3%
0%
0.1%
0.1%
February
0%
0.2%
0.1%
0.1%
March
0.1%
0%
0.2%
0.2%
April
0.3%
0.5%
0.5%
0.4%
May
0.2%
0.4%
0.5%
0.5%
June
0.2%
0.2%
0.2%
0.2%
July
0.3%
1.4%
2.9%
6.3%
August
14%
21%
19%
16%
September
16%
14%
8.9%
12%
October
13%
11%
7.0%
7.8%
November
5.4%
4.9%
4.4%
4.0%
December
2.4%
1.4%
0.6%
0.5%
Neighboring states
Maryland: arrives the second week of March, 16 weeks earlier than District of Columbia
Virginia: arrives early March, 17 weeks earlier than District of Columbia
Delaware: arrives mid March, 15 weeks earlier than District of Columbia
Pennsylvania: arrives the second week of July, in the same week than District of Columbia
Common questions
When do Laughing Gulls arrive in District of Columbia?
Laughing Gulls reach District of Columbia in the second week of July, are common by late July, peak in mid August (18% of checklists), and most are gone by early November.
When do Laughing Gulls leave District of Columbia?
Most Laughing Gulls have left District of Columbia by early November, when reports fall below half their usual rate. Stragglers are still reported until the second week of December.
When is the best time to see a Laughing Gull in District of Columbia?
The Laughing Gull is reported most often in mid August, on about 18% of District of Columbia checklists.
Where in District of Columbia are Laughing Gulls seen most often?
By county, District of Columbia County have the highest peak reporting rates for the Laughing Gull (counties with at least 200 checklists).