WhenToBird

Sternula antillarum · Laridae

When Do Least Terns Arrive in California?

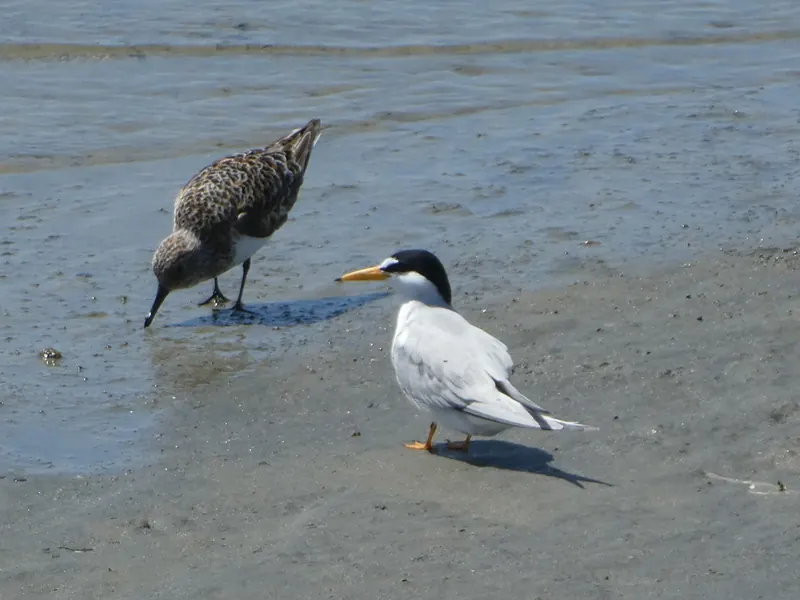
Adult Least Tern
Photo: datadan, CC BY 4.0 via iNaturalist

Least Terns arrive in California in early May, peak in the second week of July (3.0% of checklists), and most are gone by mid August.

When to look

First arrivalsMay 1-7early May
Common byMay 1-7early May
PeakJul 8-14the second week of July
Most gone byAug 15-21mid August

Best: the second week of July. First arrivals early May; most are gone by mid August. Peak: on about 3.0% of California checklists.

  1. Jannot usually seen
  2. Febnot usually seen
  3. Marnot usually seen
  4. Apruncommon
  5. Maycommon
  6. Junpeak season
  7. Julpeak season
  8. Augpeak season
  9. Seprare
  10. Octnot usually seen
  11. Novnot usually seen
  12. Decnot usually seen

Darker months: more checklists report it. Outlined: peak month.

0%1%2%3%4%Jan 1-7: 0% of 112336 checklistsJan 8-14: 0% of 85518 checklistsJan 15-21: 0% of 86488 checklistsJan 22-31: 0% of 116174 checklistsFeb 1-7: 0% of 75171 checklistsFeb 8-14: 0% of 84467 checklistsFeb 15-21: 0% of 105683 checklistsFeb 22-28: 0% of 83396 checklistsMar 1-7: 0% of 77470 checklistsMar 8-14: 0% of 75180 checklistsMar 15-21: 0% of 80770 checklistsMar 22-31: 0.1% of 114116 checklistsApr 1-7: 0.1% of 84057 checklistsApr 8-14: 0.1% of 83692 checklistsApr 15-21: 0.3% of 89242 checklistsApr 22-30: 0.7% of 114289 checklistsMay 1-7: 1.1% of 85728 checklistsMay 8-14: 1.5% of 91984 checklistsMay 15-21: 1.5% of 75478 checklistsMay 22-31: 1.6% of 106250 checklistsJun 1-7: 1.8% of 70051 checklistsJun 8-14: 2.1% of 67485 checklistsJun 15-21: 2.1% of 66269 checklistsJun 22-30: 2.6% of 79172 checklistsJul 1-7: 2.8% of 62877 checklistsJul 8-14: 3.1% of 60328 checklistsJul 15-21: 3.1% of 59705 checklistsJul 22-31: 2.8% of 83796 checklistsAug 1-7: 2.2% of 60215 checklistsAug 8-14: 1.7% of 60172 checklistsAug 15-21: 1.1% of 59877 checklistsAug 22-31: 0.5% of 89107 checklistsSep 1-7: 0.2% of 72000 checklistsSep 8-14: 0.1% of 71228 checklistsSep 15-21: 0.1% of 76808 checklistsSep 22-30: 0.1% of 100204 checklistsOct 1-7: 0% of 76571 checklistsOct 8-14: 0.1% of 80874 checklistsOct 15-21: 0% of 74581 checklistsOct 22-31: 0% of 97498 checklistsNov 1-7: 0% of 70851 checklistsNov 8-14: 0% of 72431 checklistsNov 15-21: 0% of 66767 checklistsNov 22-30: 0% of 94737 checklistsDec 1-7: 0% of 65393 checklistsDec 8-14: 0% of 67449 checklistsDec 15-21: 0% of 83421 checklistsDec 22-31: 0% of 124993 checklistsJanFebMarAprMayJunJulAugSepOctNovDec
Share of complete checklists reporting it, by week (4 per month). Grey bars: fewer than 10 checklists, not counted.

Frequency is the share of complete checklists in California that listed the bird, 2016–2025. It is not a head count, and it follows where and when people go birding. How to read it.

JanFebMarAprMayJunJulAugSepOctNovDec
today
Second week of November

Each county is shaded by the share of complete checklists there that listed the bird, blended with the weeks either side. Darker is more often. It follows where people watch birds, not how many birds there are. How to read it.

Embed this map on your site

Where in California

Best counties

Share of checklists at the peak
  1. Orange CountyBest early July · 3614 checklists that week, 244,559 in all17%
  2. Alameda CountyBest mid July · 2490 checklists that week, 161,052 in all13%
  3. Ventura CountyBest late June · 1628 checklists that week, 94,391 in all11%
  4. San Diego CountyBest the second week of July · 5852 checklists that week, 405,465 in all9.5%
  5. Napa CountyBest mid July · 299 checklists that week, 18,976 in all7.4%
  6. Solano CountyBest the second week of July · 331 checklists that week, 25,325 in all7.3%

Best spots

Share of checklists at the peak
  1. Bolsa Chica Ecological Reserve (southeast)Orange County, best early June · 68 checklists that week, 5,000 in all96%
  2. Bolsa Chica Ecological ReserveOrange County, best mid May · 95 checklists that week, 7,437 in all92%
  3. Middle Harbor Shoreline ParkAlameda County, best the second week of July · 30 checklists that week, 2,089 in all91%
  4. Hayward Regional Shoreline (south)Alameda County, best the second week of July · 20 checklists that week, 327 in all88%
  5. Chula Vista Bayfront ParkSan Diego County, best the second week of June · 41 checklists that week, 1,915 in all80%

Busy spots report more of everything; compare the checklist counts before you drive anywhere.

Best time of day

In California, the Least Tern is most often listed on checklists started between 6 and 8 am (0.8% of those checklists).

0%0.5%1%12 am: too few checklists (1688) to judge1 am: too few checklists (1451) to judge2 am: too few checklists (1402) to judge3 am: too few checklists (1743) to judge4 am: too few checklists (4647) to judge5 am: too few checklists (32158) to judge6 am: 1.0% of 186053 checklists7 am: 0.7% of 444086 checklists8 am: 0.7% of 535846 checklists9 am: 0.6% of 486061 checklists10 am: 0.6% of 411130 checklists11 am: 0.5% of 325798 checklists12 pm: 0.5% of 269132 checklists1 pm: 0.6% of 244762 checklists2 pm: 0.5% of 235420 checklists3 pm: 0.5% of 232365 checklists4 pm: 0.5% of 208688 checklists5 pm: 0.6% of 146104 checklists6 pm: 0.6% of 96867 checklists7 pm: too few checklists (50942) to judge8 pm: too few checklists (14803) to judge9 pm: too few checklists (5561) to judge10 pm: too few checklists (3546) to judge11 pm: too few checklists (2092) to judge12a3a6a9a12p3p6p9p
Share of checklists started in each local hour that reported it. It reflects when people go birding as well as when birds are active. Grey hours have too few checklists (under 2% of the state’s, or under 200) to judge.
Week-by-week table
MonthDays 1-78-1415-2122-end
January0%0%0%0%
February0%0%0%0%
March0%0%0%0.1%
April0.1%0.1%0.3%0.7%
May1.1%1.5%1.5%1.6%
June1.8%2.1%2.1%2.6%
July2.8%3.1%3.1%2.8%
August2.2%1.7%1.1%0.5%
September0.2%0.1%0.1%0.1%
October0%0.1%0%0%
November0%0%0%0%
December0%0%0%0%

Neighboring states

  • South Dakota: arrives mid May, 2 weeks later than California
  • Oklahoma: arrives the second week of May, 1 week later than California
  • Nebraska: arrives mid May, 2 weeks later than California
  • Texas: arrives early April, 4 weeks earlier than California

Common questions

When do Least Terns arrive in California?
Least Terns arrive in California in early May, peak in the second week of July (3.0% of checklists), and most are gone by mid August.
When do Least Terns leave California?
Most Least Terns have left California by mid August, when reports fall below half their usual rate.
When is the best time to see a Least Tern in California?
The Least Tern is reported most often in the second week of July, on about 3.0% of California checklists.
Where in California are Least Terns seen most often?
By county, Orange County, Alameda County, and Ventura County have the highest peak reporting rates for the Least Tern (counties with at least 200 checklists).