WhenToBird

Parkesia motacilla · Parulidae

When Do Louisiana Waterthrushes Arrive in Texas?

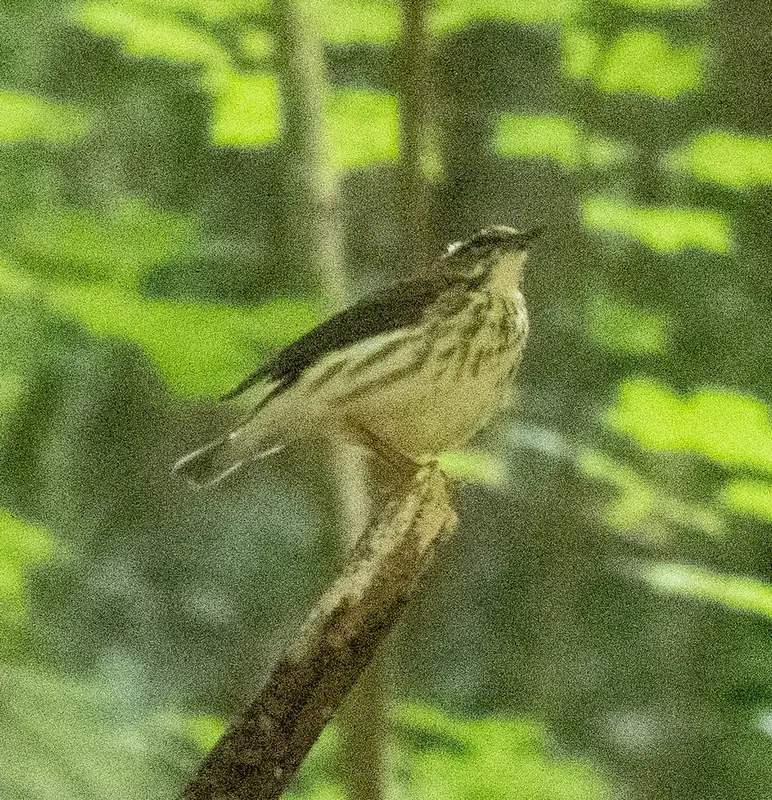
Adult Louisiana Waterthrush
Photo: Brian White, CC BY 4.0 via iNaturalist

Louisiana Waterthrushes arrive in Texas in the second week of March, peak in the second week of April (2.2% of checklists), and most are gone by late May.

When to look

First arrivalsMar 8-14the second week of March
Common byMar 8-14the second week of March
PeakApr 8-14the second week of April
Most gone byMay 22-31late May

Best: the second week of April. First arrivals the second week of March; most are gone by late May. Peak: on about 2.2% of Texas checklists.

  1. Jannot usually seen
  2. Febnot usually seen
  3. Marpeak season
  4. Aprpeak season
  5. Mayuncommon
  6. Junrare
  7. Juluncommon
  8. Auguncommon
  9. Sepuncommon
  10. Octnot usually seen
  11. Novnot usually seen
  12. Decnot usually seen

Darker months: more checklists report it. Outlined: peak month.

0%1%2%3%Jan 1-7: 0.1% of 66038 checklistsJan 8-14: 0.1% of 52445 checklistsJan 15-21: 0.1% of 52985 checklistsJan 22-31: 0.1% of 71020 checklistsFeb 1-7: 0.1% of 52306 checklistsFeb 8-14: 0.1% of 55887 checklistsFeb 15-21: 0.1% of 69016 checklistsFeb 22-28: 0.1% of 52998 checklistsMar 1-7: 0.1% of 50836 checklistsMar 8-14: 0.4% of 51749 checklistsMar 15-21: 1.3% of 53731 checklistsMar 22-31: 2.0% of 82049 checklistsApr 1-7: 2.1% of 65854 checklistsApr 8-14: 2.1% of 78434 checklistsApr 15-21: 2.2% of 92302 checklistsApr 22-30: 1.3% of 122878 checklistsMay 1-7: 0.4% of 74592 checklistsMay 8-14: 0.4% of 61008 checklistsMay 15-21: 0.3% of 43365 checklistsMay 22-31: 0.2% of 52736 checklistsJun 1-7: 0.2% of 31643 checklistsJun 8-14: 0.1% of 30131 checklistsJun 15-21: 0.1% of 26802 checklistsJun 22-30: 0.1% of 32822 checklistsJul 1-7: 0.1% of 27213 checklistsJul 8-14: 0.2% of 24555 checklistsJul 15-21: 0.4% of 24146 checklistsJul 22-31: 0.4% of 34536 checklistsAug 1-7: 0.5% of 25764 checklistsAug 8-14: 0.5% of 26347 checklistsAug 15-21: 0.7% of 28431 checklistsAug 22-31: 0.6% of 42838 checklistsSep 1-7: 0.4% of 35070 checklistsSep 8-14: 0.2% of 33893 checklistsSep 15-21: 0.1% of 32572 checklistsSep 22-30: 0.1% of 43771 checklistsOct 1-7: 0.1% of 34143 checklistsOct 8-14: 0% of 37563 checklistsOct 15-21: 0.1% of 36263 checklistsOct 22-31: 0.1% of 49170 checklistsNov 1-7: 0.1% of 43301 checklistsNov 8-14: 0% of 48744 checklistsNov 15-21: 0% of 42213 checklistsNov 22-30: 0.1% of 54455 checklistsDec 1-7: 0.1% of 40166 checklistsDec 8-14: 0.1% of 41035 checklistsDec 15-21: 0.1% of 46983 checklistsDec 22-31: 0.1% of 73015 checklistsJanFebMarAprMayJunJulAugSepOctNovDec
Share of complete checklists reporting it, by week (4 per month). Grey bars: fewer than 10 checklists, not counted.

Frequency is the share of complete checklists in Texas that listed the bird, 2016–2025. It is not a head count, and it follows where and when people go birding. How to read it.

JanFebMarAprMayJunJulAugSepOctNovDec
today
Second week of November

Each county is shaded by the share of complete checklists there that listed the bird, blended with the weeks either side. Darker is more often. It follows where people watch birds, not how many birds there are. How to read it.

Embed this map on your site

Where in Texas

Best counties

Share of checklists at the peak
  1. Red River CountyBest mid July · 13 checklists that week, 1,179 in all29%
  2. Bandera CountyBest late April · 606 checklists that week, 7,371 in all21%
  3. Wise CountyBest early May · 156 checklists that week, 4,530 in all16%
  4. Jefferson CountyBest late March · 787 checklists that week, 23,503 in all16%
  5. Van Zandt CountyBest late March · 63 checklists that week, 2,380 in all10%
  6. Refugio CountyBest mid January · 178 checklists that week, 3,809 in all8.8%

Best spots

Share of checklists at the peak
  1. Sabine WoodsJefferson County, best mid March · 117 checklists that week, 6,088 in all53%
  2. Lost Maples State Natural AreaBandera County, best late April · 203 checklists that week, 1,289 in all47%
  3. Chalk Ridge FallsBell County, best the second week of May · 20 checklists that week, 409 in all47%
  4. Lost Maples State Natural Area (Can Creek)Bandera County, best early May · 23 checklists that week, 392 in all46%
  5. Sparger ParkTarrant County, best late August · 22 checklists that week, 498 in all27%
  6. Boykin Spring LakeJasper County, best mid April · 50 checklists that week, 351 in all27%

Busy spots report more of everything; compare the checklist counts before you drive anywhere.

Best time of day

In Texas, the Louisiana Waterthrush is most often listed on checklists started between 1 and 3 pm (0.6% of those checklists).

0%0.5%1%12 am: too few checklists (898) to judge1 am: too few checklists (756) to judge2 am: too few checklists (663) to judge3 am: too few checklists (741) to judge4 am: too few checklists (1537) to judge5 am: too few checklists (6113) to judge6 am: 0.6% of 74687 checklists7 am: 0.5% of 285131 checklists8 am: 0.6% of 329960 checklists9 am: 0.5% of 267889 checklists10 am: 0.4% of 218205 checklists11 am: 0.4% of 178879 checklists12 pm: 0.5% of 153722 checklists1 pm: 0.6% of 144662 checklists2 pm: 0.6% of 138578 checklists3 pm: 0.5% of 136878 checklists4 pm: 0.5% of 137550 checklists5 pm: 0.5% of 113599 checklists6 pm: 0.4% of 81743 checklists7 pm: 0.2% of 53396 checklists8 pm: too few checklists (17221) to judge9 pm: too few checklists (4048) to judge10 pm: too few checklists (1965) to judge11 pm: too few checklists (990) to judge12a3a6a9a12p3p6p9p
Share of checklists started in each local hour that reported it. It reflects when people go birding as well as when birds are active. Grey hours have too few checklists (under 2% of the state’s, or under 200) to judge.
Week-by-week table
MonthDays 1-78-1415-2122-end
January0.1%0.1%0.1%0.1%
February0.1%0.1%0.1%0.1%
March0.1%0.4%1.3%2.0%
April2.1%2.1%2.2%1.3%
May0.4%0.4%0.3%0.2%
June0.2%0.1%0.1%0.1%
July0.1%0.2%0.4%0.4%
August0.5%0.5%0.7%0.6%
September0.4%0.2%0.1%0.1%
October0.1%0%0.1%0.1%
November0.1%0%0%0.1%
December0.1%0.1%0.1%0.1%

Neighboring states

  • Louisiana: arrives the second week of March, in the same week than Texas
  • Oklahoma: arrives late March, 2 weeks later than Texas
  • Arkansas: arrives mid March, 1 week later than Texas
  • Mississippi: arrives mid March, 1 week later than Texas

Common questions

When do Louisiana Waterthrushes arrive in Texas?
Louisiana Waterthrushes arrive in Texas in the second week of March, peak in the second week of April (2.2% of checklists), and most are gone by late May.
When do Louisiana Waterthrushes leave Texas?
Most Louisiana Waterthrushes have left Texas by late May, when reports fall below half their usual rate.
When is the best time to see a Louisiana Waterthrush in Texas?
The Louisiana Waterthrush is reported most often in the second week of April, on about 2.2% of Texas checklists.
Where in Texas are Louisiana Waterthrushes seen most often?
By county, Red River County, Bandera County, and Wise County have the highest peak reporting rates for the Louisiana Waterthrush (counties with at least 200 checklists).