WhenToBird

Zenaida macroura · Columbidae

When Do Mourning Doves Arrive in Hawaii?

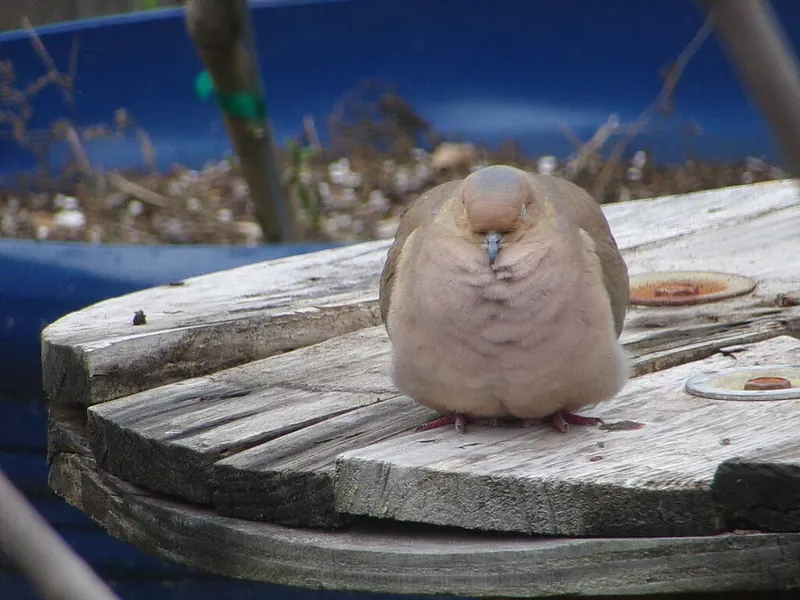
Adult male Mourning Dove
Photo: Texas Bird Family, CC BY 4.0 via iNaturalist

The Mourning Dove is in Hawaii all year. It turns up on about 2.1% of checklists at its peak (the second week of March) and on 1.0% in its quietest week (early July).

When to look

PresentAll year
Peak weekMar 8-14the second week of March
Quietest weekJul 1-7early July

Best: the second week of March. Here all year. Peak: on about 2.1% of Hawaii checklists.

  1. Jancommon
  2. Febpeak season
  3. Marpeak season
  4. Aprpeak season
  5. Maycommon
  6. Juncommon
  7. Julcommon
  8. Augcommon
  9. Seppeak season
  10. Octpeak season
  11. Novpeak season
  12. Deccommon

Darker months: more checklists report it. Outlined: peak month.

0%1%2%3%Jan 1-7: 1.7% of 5223 checklistsJan 8-14: 1.1% of 4322 checklistsJan 15-21: 1.4% of 4791 checklistsJan 22-31: 1.4% of 6113 checklistsFeb 1-7: 1.5% of 4916 checklistsFeb 8-14: 1.3% of 4778 checklistsFeb 15-21: 1.3% of 5119 checklistsFeb 22-28: 1.7% of 5246 checklistsMar 1-7: 2.2% of 4356 checklistsMar 8-14: 2.1% of 4127 checklistsMar 15-21: 2.1% of 4584 checklistsMar 22-31: 1.8% of 5941 checklistsApr 1-7: 1.6% of 3596 checklistsApr 8-14: 1.4% of 3301 checklistsApr 15-21: 1.5% of 3268 checklistsApr 22-30: 1.6% of 3732 checklistsMay 1-7: 1.8% of 2628 checklistsMay 8-14: 1.3% of 3151 checklistsMay 15-21: 1.3% of 2566 checklistsMay 22-31: 1.4% of 4054 checklistsJun 1-7: 2.1% of 2703 checklistsJun 8-14: 1.2% of 2731 checklistsJun 15-21: 1.1% of 2826 checklistsJun 22-30: 1.1% of 3671 checklistsJul 1-7: 1.0% of 2692 checklistsJul 8-14: 1.0% of 2734 checklistsJul 15-21: 1.5% of 2412 checklistsJul 22-31: 1.5% of 3581 checklistsAug 1-7: 1.3% of 2426 checklistsAug 8-14: 1.6% of 2669 checklistsAug 15-21: 1.7% of 2605 checklistsAug 22-31: 1.3% of 3159 checklistsSep 1-7: 1.2% of 2502 checklistsSep 8-14: 1.7% of 2975 checklistsSep 15-21: 2.0% of 3090 checklistsSep 22-30: 1.8% of 3424 checklistsOct 1-7: 1.9% of 2897 checklistsOct 8-14: 1.5% of 3420 checklistsOct 15-21: 1.5% of 3802 checklistsOct 22-31: 1.6% of 4531 checklistsNov 1-7: 1.8% of 3215 checklistsNov 8-14: 2.2% of 3704 checklistsNov 15-21: 1.6% of 3216 checklistsNov 22-30: 1.3% of 4153 checklistsDec 1-7: 1.2% of 3627 checklistsDec 8-14: 1.6% of 3710 checklistsDec 15-21: 1.5% of 3731 checklistsDec 22-31: 1.1% of 6597 checklistsJanFebMarAprMayJunJulAugSepOctNovDec
Share of complete checklists reporting it, by week (4 per month). Grey bars: fewer than 10 checklists, not counted.

Frequency is the share of complete checklists in Hawaii that listed the bird, 2016–2025. It is not a head count, and it follows where and when people go birding. How to read it.

JanFebMarAprMayJunJulAugSepOctNovDec
today
Second week of November

Each county is shaded by the share of complete checklists there that listed the bird, blended with the weeks either side. Darker is more often. It follows where people watch birds, not how many birds there are. How to read it.

Embed this map on your site

Where in Hawaii

Best counties

Share of checklists at the peak
  1. Maui CountyBest the second week of March · 608 checklists that week, 22,729 in all5.8%
  2. Honolulu CountyBest early November · 920 checklists that week, 47,705 in all3.9%
  3. Hawaii CountyBest the second week of August · 1108 checklists that week, 75,146 in all1.6%
  4. Kauai CountyBest the second week of September · 451 checklists that week, 32,543 in all0.5%

Best spots

Share of checklists at the peak
  1. Pearl Harbor National Wildlife RefugeHonolulu County, best mid March · 41 checklists that week, 2,121 in all56%
  2. Keālia PondMaui County, best late March · 40 checklists that week, 1,191 in all20%
  3. Keālia Pond (Kaleʻia)Maui County, best the second week of August · 21 checklists that week, 1,032 in all18%
  4. ʻŌhaiʻula BeachHawaii County, best mid January · 27 checklists that week, 394 in all17%
  5. Ka'ohe State LeaseHawaii County, best the second week of June · 26 checklists that week, 1,290 in all13%
  6. Kanaha Pond Wildlife SanctuaryMaui County, best late May · 20 checklists that week, 1,315 in all11%

Busy spots report more of everything; compare the checklist counts before you drive anywhere.

Best time of day

In Hawaii, the Mourning Dove is most often listed on checklists started between 3 and 5 pm (3.5% of those checklists).

0%1%2%3%4%12 am: too few checklists (66) to judge1 am: too few checklists (53) to judge2 am: too few checklists (70) to judge3 am: too few checklists (68) to judge4 am: too few checklists (106) to judge5 am: too few checklists (1548) to judge6 am: 1.4% of 10237 checklists7 am: 1.7% of 17935 checklists8 am: 1.5% of 18565 checklists9 am: 1.2% of 19076 checklists10 am: 0.9% of 18179 checklists11 am: 0.9% of 15530 checklists12 pm: 0.9% of 13069 checklists1 pm: 1.0% of 12798 checklists2 pm: 1.7% of 12698 checklists3 pm: 3.4% of 12213 checklists4 pm: 3.5% of 10921 checklists5 pm: 2.0% of 9437 checklists6 pm: 1.0% of 4360 checklists7 pm: too few checklists (1028) to judge8 pm: too few checklists (316) to judge9 pm: too few checklists (182) to judge10 pm: too few checklists (110) to judge11 pm: too few checklists (50) to judge12a3a6a9a12p3p6p9p
Share of checklists started in each local hour that reported it. It reflects when people go birding as well as when birds are active. Grey hours have too few checklists (under 2% of the state’s, or under 200) to judge.
Week-by-week table
MonthDays 1-78-1415-2122-end
January1.7%1.1%1.4%1.4%
February1.5%1.3%1.3%1.7%
March2.2%2.1%2.1%1.8%
April1.6%1.4%1.5%1.6%
May1.8%1.3%1.3%1.4%
June2.1%1.2%1.1%1.1%
July1.0%1.0%1.5%1.5%
August1.3%1.6%1.7%1.3%
September1.2%1.7%2.0%1.8%
October1.9%1.5%1.5%1.6%
November1.8%2.2%1.6%1.3%
December1.2%1.6%1.5%1.1%

Neighboring states

  • California: year-round, peaks the second week of May
  • Nevada: year-round, peaks the second week of May
  • Oregon: all year, most in summer, peaks mid May
  • Arizona: year-round, peaks early July

Common questions

When do Mourning Doves arrive in Hawaii?
The Mourning Dove is in Hawaii all year. It turns up on about 2.1% of checklists at its peak (the second week of March) and on 1.0% in its quietest week (early July).
When do Mourning Doves leave Hawaii?
The Mourning Dove does not leave Hawaii: it is reported all year, from 1.0% of checklists in early July to 2.1% in the second week of March.
When is the best time to see a Mourning Dove in Hawaii?
The Mourning Dove is reported most often in the second week of March, on about 2.1% of Hawaii checklists.
Where in Hawaii are Mourning Doves seen most often?
By county, Maui County, Honolulu County, and Hawaii County have the highest peak reporting rates for the Mourning Dove (counties with at least 200 checklists).