WhenToBird

Troglodytes pacificus · Troglodytidae

When Do Pacific Wrens Arrive in Washington?

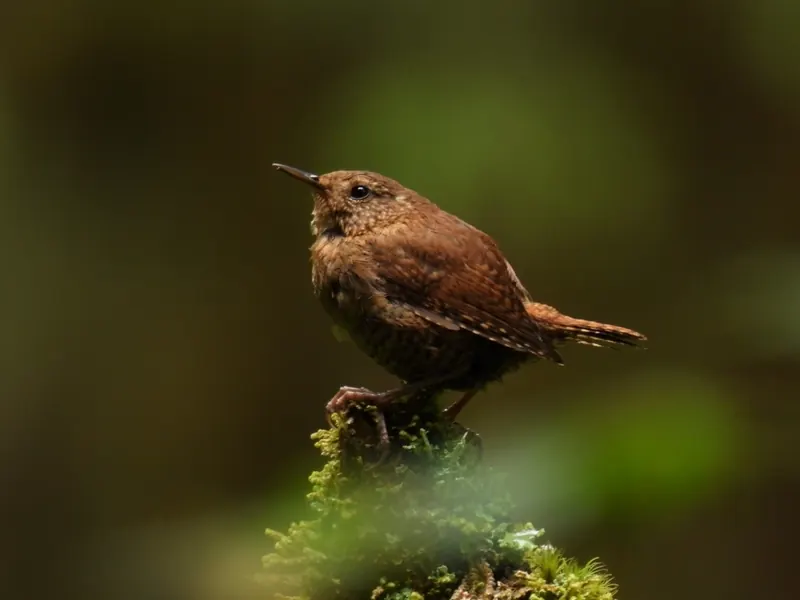
Adult Pacific Wren
Photo: louisiv826, CC BY 4.0 via iNaturalist

Pacific Wrens are in Washington all year, but most are here in winter: numbers build from early October, peak in mid November (16% of checklists), and fall back by mid April. In the quietest week (mid August) they are still on about 3.3% of checklists.

When to look

Numbers buildOct 1-7early October
PeakNov 15-21mid November
Fall back byApr 15-21mid April
FewestAug 15-21mid August

Best: mid November. Here all year; numbers build from early October and fall back by mid April. Peak: on about 16% of Washington checklists.

  1. Jancommon
  2. Febcommon
  3. Marpeak season
  4. Aprcommon
  5. Maycommon
  6. Juncommon
  7. Julcommon
  8. Auguncommon
  9. Sepcommon
  10. Octpeak season
  11. Novpeak season
  12. Decpeak season

Darker months: more checklists report it. Outlined: peak month.

0%5%10%15%20%Jan 1-7: 11% of 41928 checklistsJan 8-14: 10% of 31152 checklistsJan 15-21: 11% of 31753 checklistsJan 22-31: 11% of 42530 checklistsFeb 1-7: 11% of 29739 checklistsFeb 8-14: 10% of 32746 checklistsFeb 15-21: 9.4% of 40328 checklistsFeb 22-28: 11% of 28432 checklistsMar 1-7: 12% of 30758 checklistsMar 8-14: 13% of 29368 checklistsMar 15-21: 13% of 32580 checklistsMar 22-31: 13% of 45614 checklistsApr 1-7: 12% of 33997 checklistsApr 8-14: 11% of 34729 checklistsApr 15-21: 9.8% of 38474 checklistsApr 22-30: 9.1% of 52185 checklistsMay 1-7: 7.4% of 44236 checklistsMay 8-14: 6.2% of 48708 checklistsMay 15-21: 5.8% of 41742 checklistsMay 22-31: 5.8% of 57082 checklistsJun 1-7: 5.7% of 39193 checklistsJun 8-14: 6.4% of 36042 checklistsJun 15-21: 6.7% of 34003 checklistsJun 22-30: 7.3% of 39711 checklistsJul 1-7: 7.1% of 31949 checklistsJul 8-14: 6.6% of 29086 checklistsJul 15-21: 6.0% of 28045 checklistsJul 22-31: 4.9% of 38275 checklistsAug 1-7: 3.9% of 28846 checklistsAug 8-14: 3.3% of 28036 checklistsAug 15-21: 3.3% of 27614 checklistsAug 22-31: 3.3% of 40356 checklistsSep 1-7: 4.1% of 31214 checklistsSep 8-14: 4.7% of 27795 checklistsSep 15-21: 6.3% of 29677 checklistsSep 22-30: 8.6% of 35241 checklistsOct 1-7: 11% of 28605 checklistsOct 8-14: 13% of 28655 checklistsOct 15-21: 15% of 24643 checklistsOct 22-31: 16% of 34874 checklistsNov 1-7: 16% of 25658 checklistsNov 8-14: 16% of 25700 checklistsNov 15-21: 16% of 24331 checklistsNov 22-30: 16% of 32784 checklistsDec 1-7: 15% of 24099 checklistsDec 8-14: 15% of 23339 checklistsDec 15-21: 16% of 27666 checklistsDec 22-31: 14% of 42130 checklistsJanFebMarAprMayJunJulAugSepOctNovDec
Share of complete checklists reporting it, by week (4 per month). Grey bars: fewer than 10 checklists, not counted.

Frequency is the share of complete checklists in Washington that listed the bird, 2016–2025. It is not a head count, and it follows where and when people go birding. How to read it.

JanFebMarAprMayJunJulAugSepOctNovDec
today
Second week of November

Each county is shaded by the share of complete checklists there that listed the bird, blended with the weeks either side. Darker is more often. It follows where people watch birds, not how many birds there are. How to read it.

Embed this map on your site

Where in Washington

Best counties

Share of checklists at the peak
  1. Wahkiakum CountyBest late March · 169 checklists that week, 5,618 in all39%
  2. San Juan CountyBest mid November · 358 checklists that week, 35,337 in all31%
  3. Clallam CountyBest late October · 2260 checklists that week, 85,362 in all27%
  4. Island CountyBest early November · 792 checklists that week, 46,092 in all26%
  5. Grays Harbor CountyBest mid October · 472 checklists that week, 28,443 in all24%
  6. Lewis CountyBest mid November · 138 checklists that week, 12,910 in all24%

Best spots

Share of checklists at the peak
  1. Washington State Department of Natural Resources (WADNR) State Resource Management Area (Left Fork Skamokawa Creek)Wahkiakum County, best late March · 49 checklists that week, 1,179 in all91%
  2. Olympic National Park (Jackson Creek)Jefferson County, best late June · 21 checklists that week, 277 in all89%
  3. Burton Acres ParkKing County, best early April · 23 checklists that week, 642 in all87%
  4. Washington State Department of Natural Resources (WADNR) State Resource Management Area (North Sultan)Snohomish County, best late March · 26 checklists that week, 118 in all87%
  5. Lord Hill County ParkSnohomish County, best mid January · 23 checklists that week, 302 in all87%
  6. Dungeness National Wildlife Refuge (southwest)Clallam County, best the second week of April · 24 checklists that week, 733 in all85%

Busy spots report more of everything; compare the checklist counts before you drive anywhere.

Best time of day

In Washington, the Pacific Wren is most often listed on checklists started between 7 and 9 am (12% of those checklists).

0%5%10%15%12 am: too few checklists (796) to judge1 am: too few checklists (776) to judge2 am: too few checklists (709) to judge3 am: too few checklists (901) to judge4 am: too few checklists (3221) to judge5 am: too few checklists (16576) to judge6 am: 10% of 56744 checklists7 am: 12% of 133294 checklists8 am: 12% of 184196 checklists9 am: 11% of 186303 checklists10 am: 11% of 177063 checklists11 am: 9.9% of 154936 checklists12 pm: 8.9% of 138061 checklists1 pm: 8.7% of 127449 checklists2 pm: 8.3% of 121511 checklists3 pm: 8.0% of 107793 checklists4 pm: 6.7% of 82862 checklists5 pm: 5.0% of 57183 checklists6 pm: 4.0% of 39886 checklists7 pm: too few checklists (26969) to judge8 pm: too few checklists (12427) to judge9 pm: too few checklists (3658) to judge10 pm: too few checklists (1500) to judge11 pm: too few checklists (834) to judge12a3a6a9a12p3p6p9p
Share of checklists started in each local hour that reported it. It reflects when people go birding as well as when birds are active. Grey hours have too few checklists (under 2% of the state’s, or under 200) to judge.
Week-by-week table
MonthDays 1-78-1415-2122-end
January11%10%11%11%
February11%10%9.4%11%
March12%13%13%13%
April12%11%9.8%9.1%
May7.4%6.2%5.8%5.8%
June5.7%6.4%6.7%7.3%
July7.1%6.6%6.0%4.9%
August3.9%3.3%3.3%3.3%
September4.1%4.7%6.3%8.6%
October11%13%15%16%
November16%16%16%16%
December15%15%16%14%

Neighboring states

  • Oregon: arrives late September, 1 week earlier than Washington
  • Idaho: arrives early September, 4 weeks earlier than Washington
  • Montana: arrives late March, 23 weeks later than Washington
  • California: year-round, peaks the second week of June

Common questions

When do Pacific Wrens arrive in Washington?
Pacific Wrens are in Washington all year, but most are here in winter: numbers build from early October, peak in mid November (16% of checklists), and fall back by mid April. In the quietest week (mid August) they are still on about 3.3% of checklists.
When do Pacific Wrens leave Washington?
Pacific Wrens never fully leave Washington: numbers fall back below half their usual rate by mid April, but some are still reported in every week, about 3.3% of checklists at the low.
When is the best time to see a Pacific Wren in Washington?
The Pacific Wren is reported most often in mid November, on about 16% of Washington checklists.
Where in Washington are Pacific Wrens seen most often?
By county, Wahkiakum County, San Juan County, and Clallam County have the highest peak reporting rates for the Pacific Wren (counties with at least 200 checklists).