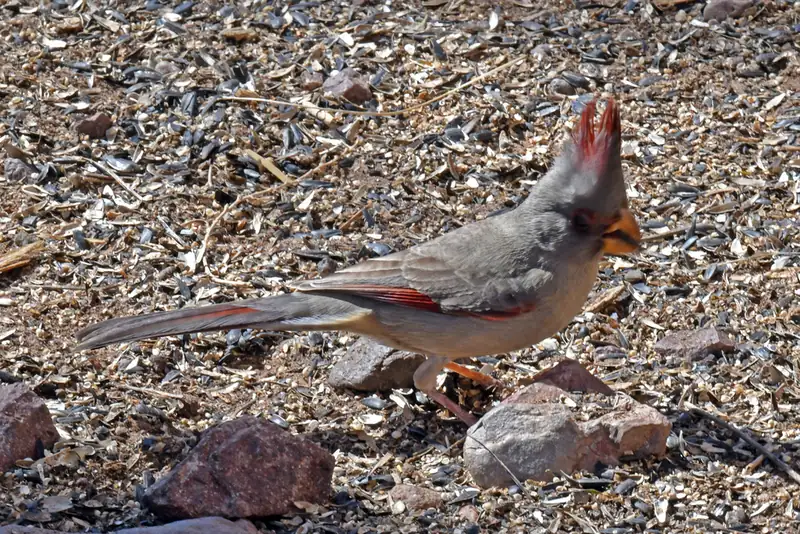
Pyrrhuloxias are in Arizona all year, but most are here in winter: numbers build from early November, peak in mid March (11% of checklists), and fall back by early May. In the quietest week (early September) they are still on about 3.5% of checklists.
When to look
Numbers buildNov 1-7early November
PeakMar 15-21mid March
Fall back byMay 1-7early May
FewestSep 1-7early September
Best: mid March. Here all year; numbers build from early November and fall back by early May. Peak: on about 11% of Arizona checklists.
Janpeak season
Febpeak season
Marpeak season
Aprpeak season
Maycommon
Juncommon
Julcommon
Augcommon
Sepcommon
Octcommon
Novpeak season
Decpeak season
Darker months: more checklists report it. Outlined: peak month.
Share of complete checklists reporting it, by week (4 per month). Grey bars: fewer than 10 checklists, not counted.
Frequency is the share of complete checklists in Arizona that listed the bird, 2016–2025. It is not a head count, and it follows where and when people go birding. How to read it.
JanFebMarAprMayJunJulAugSepOctNovDec
today
0%few checklistsno data
Each county is shaded by the share of complete checklists there that listed the bird, blended with the weeks either side. Darker is more often. It follows where people watch birds, not how many birds there are. How to read it.
Portal (northwest)Cochise County, best mid June · 34 checklists that week, 2,872 in all91%
Busy spots report more of everything; compare the checklist counts before you drive anywhere.
Best time of day
In Arizona, the Pyrrhuloxia is most often listed on checklists started between 6 and 8 am (11% of those checklists).
Share of checklists started in each local hour that reported it. It reflects when people go birding as well as when birds are active. Grey hours have too few checklists (under 2% of the state’s, or under 200) to judge.Week-by-week table
Month
Days 1-7
8-14
15-21
22-end
January
8.7%
9.0%
9.2%
9.6%
February
9.3%
9.3%
9.5%
10%
March
10%
11%
11%
10%
April
10%
9.4%
8.4%
7.9%
May
7.5%
7.0%
6.2%
6.1%
June
5.9%
5.4%
5.8%
5.9%
July
6.4%
6.4%
6.5%
6.3%
August
5.7%
5.1%
4.5%
3.6%
September
3.3%
3.5%
4.1%
4.9%
October
6.2%
6.4%
6.7%
6.8%
November
7.5%
7.3%
8.3%
8.1%
December
8.4%
8.6%
9.1%
8.5%
Neighboring states
New Mexico: arrives mid September, 6 weeks earlier than Arizona
Texas: arrives late September, 5 weeks earlier than Arizona
Common questions
When do Pyrrhuloxias arrive in Arizona?
Pyrrhuloxias are in Arizona all year, but most are here in winter: numbers build from early November, peak in mid March (11% of checklists), and fall back by early May. In the quietest week (early September) they are still on about 3.5% of checklists.
When do Pyrrhuloxias leave Arizona?
Pyrrhuloxias never fully leave Arizona: numbers fall back below half their usual rate by early May, but some are still reported in every week, about 3.5% of checklists at the low.
When is the best time to see a Pyrrhuloxia in Arizona?
The Pyrrhuloxia is reported most often in mid March, on about 11% of Arizona checklists.
Where in Arizona are Pyrrhuloxias seen most often?
By county, Cochise County, Santa Cruz County, and Greenlee County have the highest peak reporting rates for the Pyrrhuloxia (counties with at least 200 checklists).