Sitta canadensis · Sittidae
Red-breasted Nuthatch: When and Where to See It
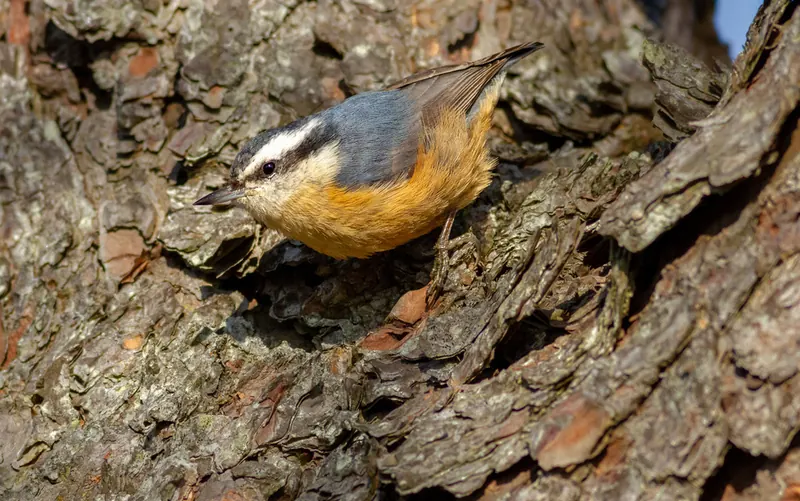
The Red-breasted Nuthatch reaches Utah first, around early July, and Georgia last, around the second week of October.
JanFebMarAprMayJunJulAugSepOctNovDec
todayEach county is shaded by the share of complete checklists there that listed the bird, blended with the weeks either side. Darker is more often. It follows where people watch birds, not how many birds there are. How to read it.
Pooled across every state in the data, so it leans toward states with the most birders.
States, in order of first arrivals
| State | First arrivals | Peak | Most gone by | Peak % |
|---|---|---|---|---|
| West Virginia | Apr 1-7 | Sep 22-30 | Feb 22-28 | 6.3% |
| Arizona | Apr 1-7 | Aug 22-31 | Dec 15-21 | 2.4% |
| Connecticut | Jun 15-21 | Sep 22-30 | May 8-14 | 6.3% |
| Utah | Jul 1-7 | Aug 15-21 | Nov 1-7 | 10% |
| Nevada | Aug 8-14 | Oct 1-7 | Oct 22-31 | 8.2% |
| Illinois | Aug 15-21 | Sep 22-30 | May 8-14 | 11% |
| Iowa | Aug 15-21 | Sep 22-30 | Feb 22-28 | 9.9% |
| California | Aug 15-21 | Oct 8-14 | Nov 1-7 | 6.4% |
| Ohio | Aug 15-21 | Sep 22-30 | May 15-21 | 7.0% |
| Pennsylvania | Aug 15-21 | Sep 22-30 | May 8-14 | 6.0% |
| Alabama | Oct 1-7 | Oct 22-31 | Apr 15-21 | 2.3% |
| Louisiana | Oct 1-7 | Nov 15-21 | Apr 1-7 | 1.9% |
| South Carolina | Oct 1-7 | Oct 22-31 | Mar 22-31 | 1.4% |
| Georgia | Oct 8-14 | Nov 8-14 | Apr 1-7 | 1.6% |
| North Carolina | May 15-21 | Oct 22-31 | Apr 8-14 | 4.6% |
| North Dakota | Jul 8-14 | Dec 15-21 | Mar 15-21 | 19% |
| South Dakota | Aug 8-14 | Sep 8-14 | Feb 15-21 | 17% |
| Colorado | Aug 8-14 | Sep 8-14 | Jan 1-7 | 14% |
| Nebraska | Aug 8-14 | Nov 22-30 | Feb 22-28 | 11% |
| Rhode Island | Aug 8-14 | Oct 15-21 | Jul 1-7 | 6.5% |
| Minnesota | Aug 15-21 | Sep 8-14 | Feb 22-28 | 16% |
| Massachusetts | Aug 15-21 | Sep 8-14 | Dec 22-31 | 11% |
| New Jersey | Aug 15-21 | Oct 8-14 | May 1-7 | 11% |
| Wisconsin | Aug 22-31 | Sep 8-14 | Dec 15-21 | 20% |
| Michigan | Aug 22-31 | Sep 15-21 | Jan 1-7 | 16% |
| New York | Aug 22-31 | Sep 22-30 | Dec 8-14 | 11% |
| Indiana | Aug 22-31 | Oct 1-7 | May 1-7 | 7.6% |
| Maryland | Aug 22-31 | Oct 15-21 | Mar 22-31 | 6.5% |
| Delaware | Sep 1-7 | Oct 15-21 | Apr 15-21 | 11% |
| Kansas | Sep 1-7 | Nov 22-30 | Mar 15-21 | 7.9% |
| Missouri | Sep 1-7 | Oct 1-7 | Mar 22-31 | 5.6% |
| Virginia | Sep 1-7 | Oct 22-31 | Apr 8-14 | 5.6% |
| District of Columbia | Sep 1-7 | Oct 1-7 | Mar 1-7 | 2.9% |
| Arkansas | Sep 8-14 | Oct 22-31 | Apr 1-7 | 8.1% |
| Oklahoma | Sep 8-14 | Nov 22-30 | Apr 1-7 | 5.3% |
| Kentucky | Sep 8-14 | Oct 15-21 | Apr 8-14 | 4.9% |
| Tennessee | Sep 8-14 | Oct 22-31 | Apr 22-30 | 3.6% |
| Mississippi | Sep 22-30 | Dec 15-21 | Apr 15-21 | 2.4% |
| Texas | Sep 22-30 | Nov 22-30 | Apr 1-7 | 1.2% |
| Washington | – | Aug 22-31 | – | 29% |
| Idaho | – | Sep 15-21 | – | 27% |
| Maine | – | Sep 8-14 | – | 26% |
| Alaska | – | Feb 22-28 | – | 24% |
| Montana | – | Aug 22-31 | – | 23% |
| Oregon | – | Sep 1-7 | – | 22% |
| New Hampshire | – | Sep 8-14 | – | 22% |
| Wyoming | – | Sep 1-7 | – | 18% |
| Vermont | – | Sep 8-14 | – | 18% |
| New Mexico | – | Sep 15-21 | – | 6.1% |
Winter visitor in: North Dakota, Mississippi, North Carolina
Summer visitor in: West Virginia, Arizona, Connecticut