Platalea ajaja · Threskiornithidae
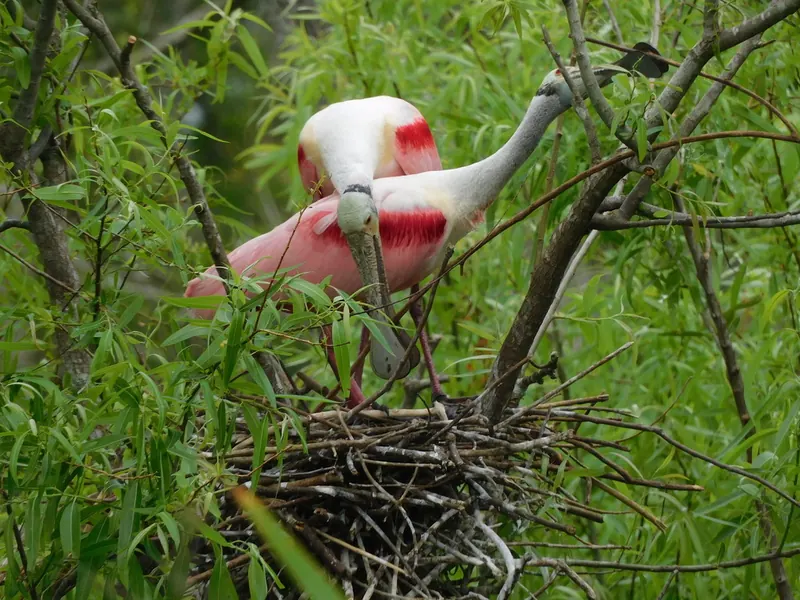
Roseate Spoonbill: When and Where to See It Photo: Matt Schultz, CC0 1.0 via iNaturalist The Roseate Spoonbill has a page for 10 states in our data.
Play the year
Jan Feb Mar Apr May Jun Jul Aug Sep Oct Nov Dec
today Each county is shaded by the share of complete checklists there that listed the bird, blended with the weeks either side. Darker is more often. It follows where people watch birds, not how many birds there are. How to read it .
Embed this map on your site
0% 0.5% 1% Jan 1-7: 0.7% of 1114036 checklists Jan 8-14: 0.8% of 824708 checklists Jan 15-21: 0.8% of 825978 checklists Jan 22-31: 0.8% of 1105853 checklists Feb 1-7: 0.8% of 779772 checklists Feb 8-14: 0.7% of 864504 checklists Feb 15-21: 0.6% of 1127933 checklists Feb 22-28: 0.8% of 840124 checklists Mar 1-7: 0.8% of 839610 checklists Mar 8-14: 0.7% of 870138 checklists Mar 15-21: 0.7% of 898456 checklists Mar 22-31: 0.7% of 1335637 checklists Apr 1-7: 0.7% of 1030617 checklists Apr 8-14: 0.8% of 1124024 checklists Apr 15-21: 1.0% of 1194575 checklists Apr 22-30: 0.8% of 1675723 checklists May 1-7: 0.5% of 1449080 checklists May 8-14: 0.3% of 1538353 checklists May 15-21: 0.3% of 1219898 checklists May 22-31: 0.4% of 1452282 checklists Jun 1-7: 0.4% of 900636 checklists Jun 8-14: 0.4% of 829907 checklists Jun 15-21: 0.4% of 773255 checklists Jun 22-30: 0.5% of 916255 checklists Jul 1-7: 0.5% of 717733 checklists Jul 8-14: 0.5% of 658223 checklists Jul 15-21: 0.7% of 638752 checklists Jul 22-31: 0.7% of 895727 checklists Aug 1-7: 0.6% of 655651 checklists Aug 8-14: 0.6% of 650038 checklists Aug 15-21: 0.7% of 654639 checklists Aug 22-31: 0.6% of 974928 checklists Sep 1-7: 0.6% of 765914 checklists Sep 8-14: 0.6% of 738674 checklists Sep 15-21: 0.5% of 750433 checklists Sep 22-30: 0.6% of 944196 checklists Oct 1-7: 0.6% of 760106 checklists Oct 8-14: 0.6% of 793131 checklists Oct 15-21: 0.6% of 728727 checklists Oct 22-31: 0.7% of 959954 checklists Nov 1-7: 0.8% of 709464 checklists Nov 8-14: 0.9% of 693424 checklists Nov 15-21: 0.8% of 653952 checklists Nov 22-30: 0.7% of 871137 checklists Dec 1-7: 0.7% of 627591 checklists Dec 8-14: 0.7% of 642427 checklists Dec 15-21: 0.6% of 775638 checklists Dec 22-31: 0.7% of 1132751 checklists Jan Feb Mar Apr May Jun Jul Aug Sep Oct Nov Dec Share of complete checklists reporting it, by week (4 per month). Grey bars: fewer than 10 checklists, not counted. Pooled across every state in the data, so it leans toward states with the most birders.
States, in order of first arrivals Passes through: District of Columbia , Arkansas
Summer visitor in: Georgia , South Carolina , Alabama , Mississippi , Delaware