Birding spot · Yavapai County, Arizona
Birding at Sedona Wetlands Preserve: What You'll See Each Week In November, the birds most often reported at Sedona Wetlands Preserve are American Coot (93%), White-crowned Sparrow (91%), and Mallard (89%). It is busiest in spring, when 93 species turn up on at least 1 in 20 checklists, and species counts peak in late April (97 species). 238 species have been reported here across 4,780 complete checklists from 1,609 birders.
Species by week 0 20 40 60 80 100 Jan 1-7: 61 species on 5%+ of 97 checklists Jan 8-14: 53 species on 5%+ of 88 checklists Jan 15-21: 49 species on 5%+ of 86 checklists Jan 22-31: 53 species on 5%+ of 101 checklists Feb 1-7: 54 species on 5%+ of 68 checklists Feb 8-14: 60 species on 5%+ of 74 checklists Feb 15-21: 54 species on 5%+ of 90 checklists Feb 22-28: 60 species on 5%+ of 95 checklists Mar 1-7: 61 species on 5%+ of 82 checklists Mar 8-14: 58 species on 5%+ of 142 checklists Mar 15-21: 65 species on 5%+ of 150 checklists Mar 22-31: 75 species on 5%+ of 209 checklists Apr 1-7: 75 species on 5%+ of 141 checklists Apr 8-14: 86 species on 5%+ of 189 checklists Apr 15-21: 94 species on 5%+ of 206 checklists Apr 22-30: 97 species on 5%+ of 322 checklists May 1-7: 92 species on 5%+ of 175 checklists May 8-14: 82 species on 5%+ of 110 checklists May 15-21: 73 species on 5%+ of 108 checklists May 22-31: 69 species on 5%+ of 115 checklists Jun 1-7: 62 species on 5%+ of 57 checklists Jun 8-14: 56 species on 5%+ of 56 checklists Jun 15-21: 60 species on 5%+ of 55 checklists Jun 22-30: 55 species on 5%+ of 49 checklists Jul 1-7: 70 species on 5%+ of 39 checklists Jul 8-14: 62 species on 5%+ of 33 checklists Jul 15-21: 60 species on 5%+ of 44 checklists Jul 22-31: 67 species on 5%+ of 73 checklists Aug 1-7: 65 species on 5%+ of 39 checklists Aug 8-14: 67 species on 5%+ of 25 checklists Aug 15-21: 77 species on 5%+ of 38 checklists Aug 22-31: 69 species on 5%+ of 52 checklists Sep 1-7: 73 species on 5%+ of 61 checklists Sep 8-14: 79 species on 5%+ of 68 checklists Sep 15-21: 73 species on 5%+ of 84 checklists Sep 22-30: 73 species on 5%+ of 111 checklists Oct 1-7: 59 species on 5%+ of 92 checklists Oct 8-14: 62 species on 5%+ of 90 checklists Oct 15-21: 73 species on 5%+ of 111 checklists Oct 22-31: 63 species on 5%+ of 153 checklists Nov 1-7: 66 species on 5%+ of 97 checklists Nov 8-14: 68 species on 5%+ of 122 checklists Nov 15-21: 65 species on 5%+ of 73 checklists Nov 22-30: 61 species on 5%+ of 132 checklists Dec 1-7: 62 species on 5%+ of 73 checklists Dec 8-14: 62 species on 5%+ of 95 checklists Dec 15-21: 57 species on 5%+ of 84 checklists Dec 22-31: 53 species on 5%+ of 126 checklists Jan Feb Mar Apr May Jun Jul Aug Sep Oct Nov Dec Number of species reported on at least 5% of complete checklists, by week (4 per month). Grey bars: fewer than 10 checklists, not counted. In November: what to expect 1 American Coot 93% 2 White-crowned Sparrow 91% 3 Mallard 89% 4 Ruddy Duck 88% 5 Bufflehead 85% 6 Northern Shoveler 84% 7 Ring-necked Duck 83% 8 Pied-billed Grebe 82% 9 American Wigeon 70% 10 Eared Grebe 69% 11 Song Sparrow 68% 12 Gadwall 68% 13 Killdeer 67% 14 Red-winged Blackbird 66% 15 Ruby-crowned Kinglet 64% Share of complete checklists at this spot that reported the bird in November. The sparkline is the whole year, with this month highlighted.
Season by season Specialties Birds reported far more often here than across Arizona.
Eared Grebe 47% of checklists here vs 2.2% statewide: 21.4× Common Goldeneye 17% of checklists here vs 0.8% statewide: 20.2× Bufflehead 52% of checklists here vs 2.9% statewide: 17.7× Virginia Rail 12% of checklists here vs 0.8% statewide: 16.0× Canvasback 27% of checklists here vs 1.8% statewide: 15.0× Common Merganser 18% of checklists here vs 1.6% statewide: 11.2× Ruddy Duck 86% of checklists here vs 9.5% statewide: 9.1× Gadwall 41% of checklists here vs 4.6% statewide: 8.9× Nearby spots Frequency is the share of complete checklists at this location that listed the bird, 2016–2025. Busy places report more of everything, and the weekly chart counts species on at least 5% of checklists so a few stray reports do not inflate it. How to read it .
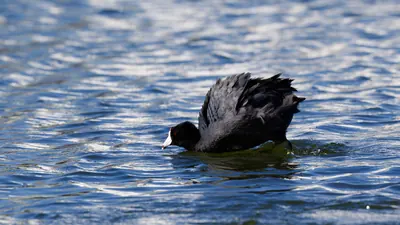 American Coot93%
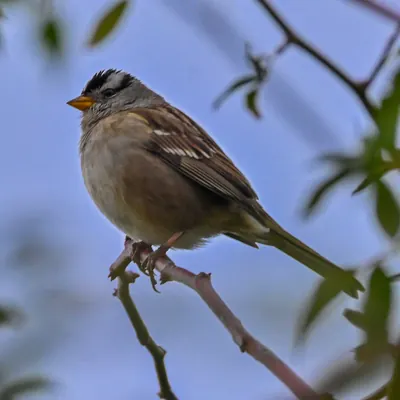 White-crowned Sparrow91%
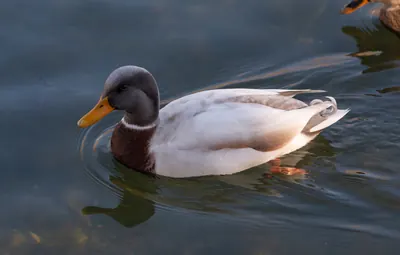 Mallard89%
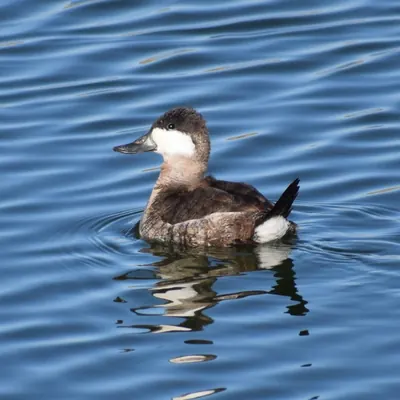 Ruddy Duck88%
 Bufflehead85%
 Northern Shoveler84%
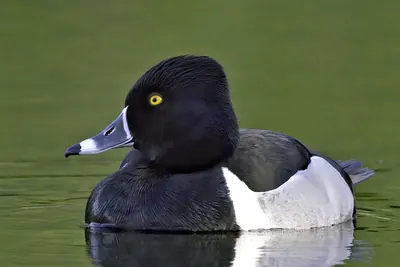 Ring-necked Duck83%
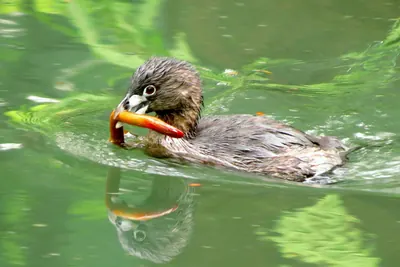 Pied-billed Grebe82%
 American Wigeon70%
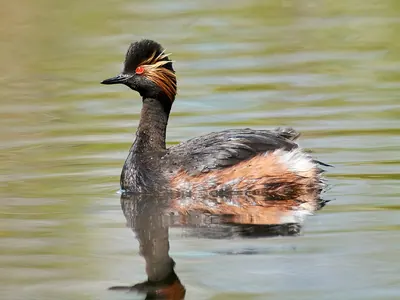 Eared Grebe69%
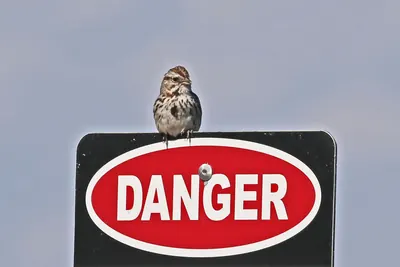 Song Sparrow68%
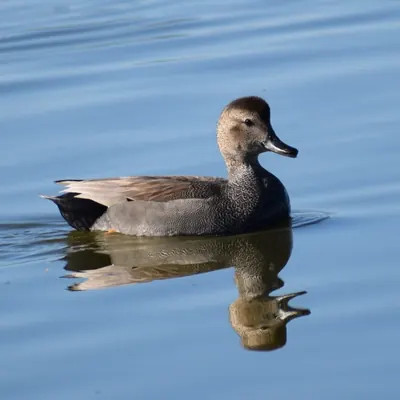 Gadwall68%
 Killdeer67%
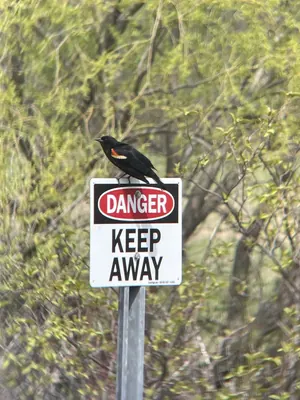 Red-winged Blackbird66%
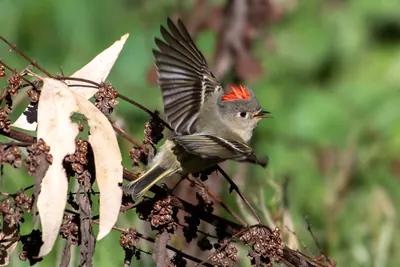 Ruby-crowned Kinglet64%