Birding spot · San Diego County, California
Birding at Anza-Borrego Desert State Park (Stag Cove): What You'll See Each Week
In November, the birds most often reported at Anza-Borrego Desert State Park (Stag Cove) are Common Raven (69%), House Finch (67%), and Phainopepla (35%). It is busiest in spring, when 42 species turn up on at least 1 in 20 checklists, and species counts peak in late April (46 species). 108 species have been reported here across 1,226 complete checklists from 651 birders.
Species by week
In November: what to expect
- 1
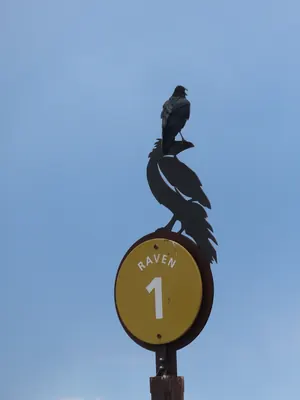 Common Raven69%
- 2
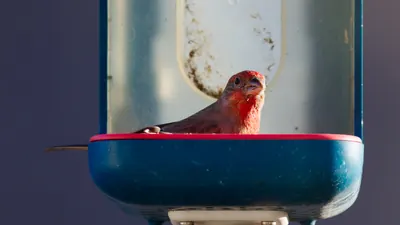 House Finch67%
- 3
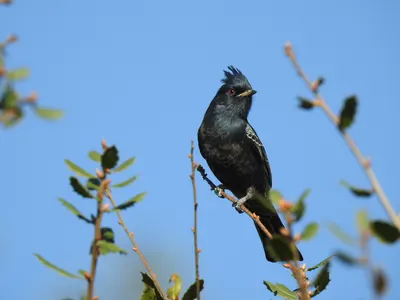 Phainopepla35%
- 4
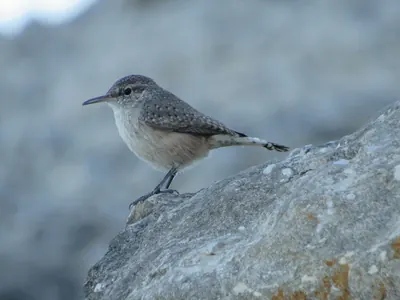 Rock Wren33%
- 5
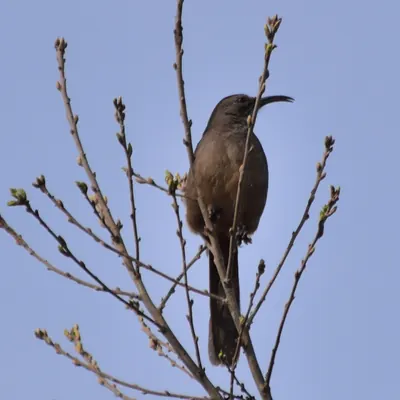 California Thrasher29%
- 6
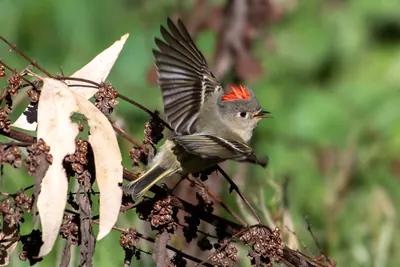 Ruby-crowned Kinglet29%
- 7
 Northern Mockingbird25%
- 8
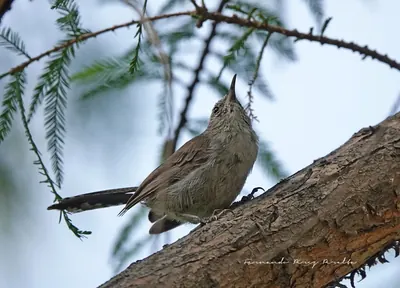 Bewick's Wren24%
- 9
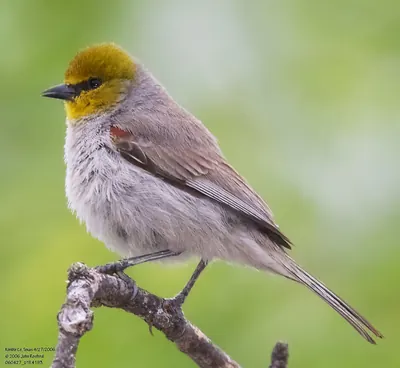 Verdin24%
- 10
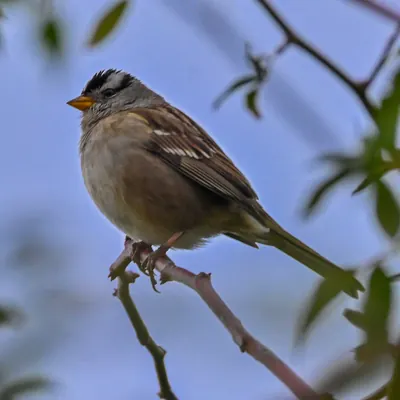 White-crowned Sparrow24%
- 11
 Yellow-rumped Warbler24%
- 12
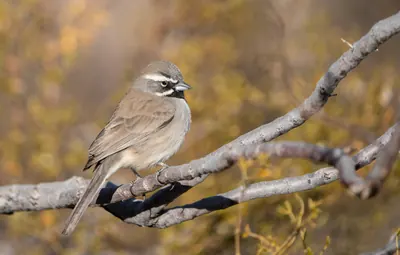 Black-throated Sparrow20%
- 13
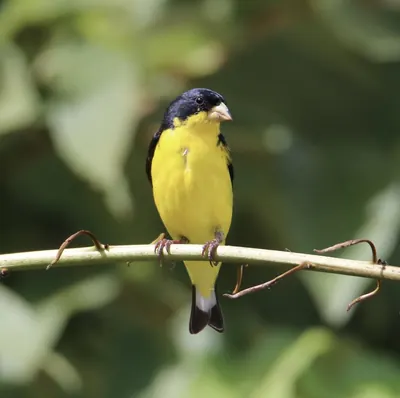 Lesser Goldfinch20%
- 14
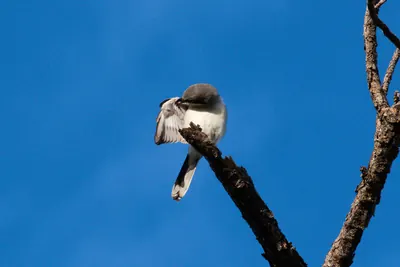 Loggerhead Shrike20%
- 15
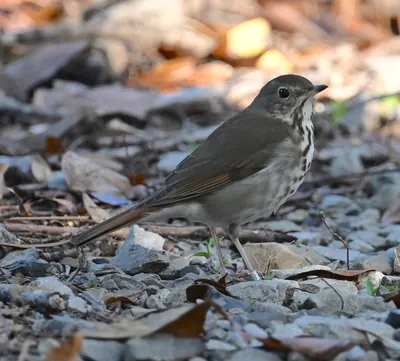 Hermit Thrush18%
Share of complete checklists at this spot that reported the bird in November. The sparkline is the whole year, with this month highlighted.
Season by season
Winter 26 species
- Common Raven52%
- House Finch41%
- Verdin38%
- Phainopepla29%
- Costa's Hummingbird28%
Spring 42 species
Summer 28 species
Fall 41 species
Specialties
Birds reported far more often here than across California.
- Black-tailed Gnatcatcher
- Verdin
- Black-throated Sparrow
- Costa's Hummingbird
- Ladder-backed Woodpecker
- White-winged Dove
- Cactus Wren
- Phainopepla
Nearby spots
- Anza-Borrego Desert State Park (13.5 km)
- Anza-Borrego Desert State Park (Borrego Palm Canyon) (15.1 km)
- Agua Caliente Regional Park (21.8 km)
- Lake Cuyamaca (Cuyamaca (historical)) (25.0 km)
- Lake Cuyamaca (25.4 km)
Frequency is the share of complete checklists at this location that listed the bird, 2016–2025. Busy places report more of everything, and the weekly chart counts species on at least 5% of checklists so a few stray reports do not inflate it. How to read it.