Birding spot · Marin County, California
Birding at Bolinas Lagoon Open Space Preserve (Morses Gulch): What You'll See Each Week In November, the birds most often reported at Bolinas Lagoon Open Space Preserve (Morses Gulch) are Bufflehead (73%), Long-billed Curlew (73%), and Great Egret (67%). It is busiest in winter, when 91 species turn up on at least 1 in 20 checklists, and species counts peak in mid January (106 species). 180 species have been reported here across 874 complete checklists from 481 birders.
Species by week 0 25 50 75 100 125 Jan 1-7: 86 species on 5%+ of 23 checklists Jan 8-14: 78 species on 5%+ of 25 checklists Jan 15-21: 106 species on 5%+ of 37 checklists Jan 22-31: 89 species on 5%+ of 33 checklists Feb 1-7: 91 species on 5%+ of 28 checklists Feb 8-14: 82 species on 5%+ of 15 checklists Feb 15-21: 71 species on 5%+ of 23 checklists Feb 22-28: 92 species on 5%+ of 20 checklists Mar 1-7: 68 species on 5%+ of 22 checklists Mar 8-14: 83 species on 5%+ of 19 checklists Mar 15-21: 98 species on 5%+ of 14 checklists Mar 22-31: 78 species on 5%+ of 29 checklists Apr 1-7: 84 species on 5%+ of 10 checklists Apr 8-14: 71 species on 5%+ of 12 checklists Apr 15-21: 93 species on 5%+ of 12 checklists Apr 22-30: 78 species on 5%+ of 17 checklists May 1-7: 76 species on 5%+ of 11 checklists May 8-14: low data (5 checklists) May 15-21: 46 species on 5%+ of 10 checklists May 22-31: 59 species on 5%+ of 13 checklists Jun 1-7: 52 species on 5%+ of 13 checklists Jun 8-14: 49 species on 5%+ of 23 checklists Jun 15-21: 44 species on 5%+ of 11 checklists Jun 22-30: 66 species on 5%+ of 15 checklists Jul 1-7: 81 species on 5%+ of 16 checklists Jul 8-14: 37 species on 5%+ of 21 checklists Jul 15-21: 57 species on 5%+ of 20 checklists Jul 22-31: 63 species on 5%+ of 17 checklists Aug 1-7: 43 species on 5%+ of 10 checklists Aug 8-14: 56 species on 5%+ of 31 checklists Aug 15-21: 50 species on 5%+ of 22 checklists Aug 22-31: 59 species on 5%+ of 10 checklists Sep 1-7: 70 species on 5%+ of 19 checklists Sep 8-14: low data (9 checklists) Sep 15-21: 84 species on 5%+ of 14 checklists Sep 22-30: 67 species on 5%+ of 30 checklists Oct 1-7: 69 species on 5%+ of 23 checklists Oct 8-14: 103 species on 5%+ of 16 checklists Oct 15-21: low data (8 checklists) Oct 22-31: 81 species on 5%+ of 13 checklists Nov 1-7: 106 species on 5%+ of 15 checklists Nov 8-14: 80 species on 5%+ of 16 checklists Nov 15-21: 75 species on 5%+ of 21 checklists Nov 22-30: 81 species on 5%+ of 27 checklists Dec 1-7: low data (9 checklists) Dec 8-14: 80 species on 5%+ of 15 checklists Dec 15-21: 76 species on 5%+ of 11 checklists Dec 22-31: 65 species on 5%+ of 41 checklists Jan Feb Mar Apr May Jun Jul Aug Sep Oct Nov Dec Number of species reported on at least 5% of complete checklists, by week (4 per month). Grey bars: fewer than 10 checklists, not counted. In November: what to expect 1 Bufflehead 73% 2 Long-billed Curlew 73% 3 Great Egret 67% 4 Double-crested Cormorant 65% 5 American Wigeon 63% 6 Great Blue Heron 63% 7 Marbled Godwit 59% 8 Western Gull 58% 9 Willet 57% 10 Turkey Vulture 54% 11 Brown Pelican 51% 12 American Avocet 49% 13 Belted Kingfisher 49% 14 Snowy Egret 49% 15 Green-winged Teal 48% Share of complete checklists at this spot that reported the bird in November. The sparkline is the whole year, with this month highlighted.
Season by season Specialties Birds reported far more often here than across California.
Nearby spots Frequency is the share of complete checklists at this location that listed the bird, 2016–2025. Busy places report more of everything, and the weekly chart counts species on at least 5% of checklists so a few stray reports do not inflate it. How to read it .
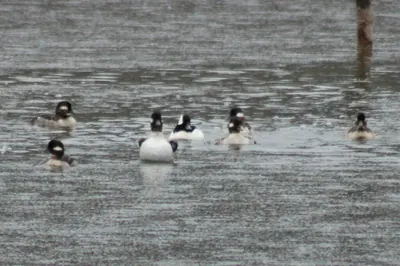 Bufflehead73%
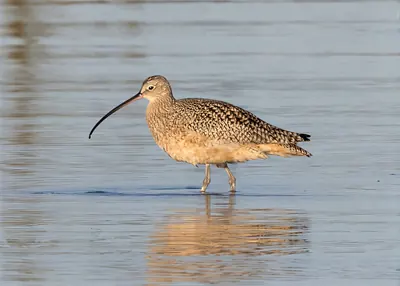 Long-billed Curlew73%
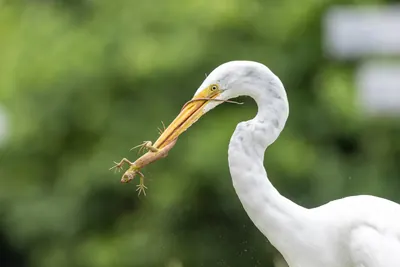 Great Egret67%
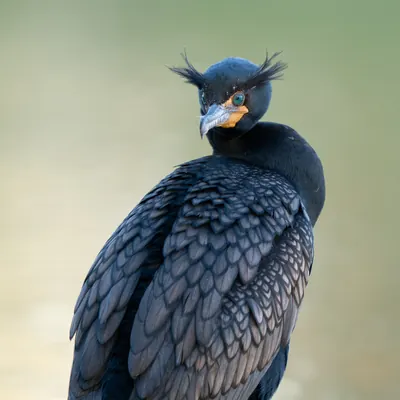 Double-crested Cormorant65%
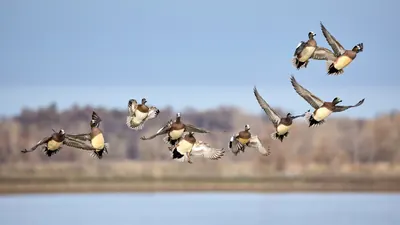 American Wigeon63%
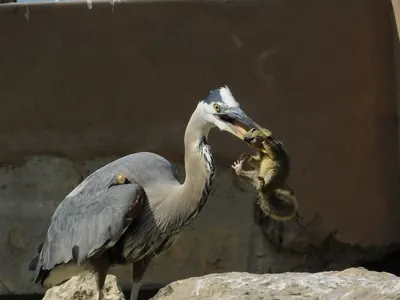 Great Blue Heron63%
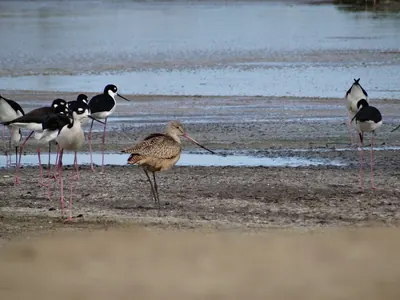 Marbled Godwit59%
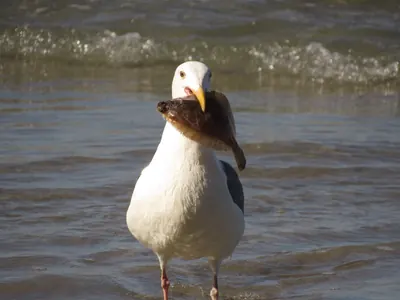 Western Gull58%
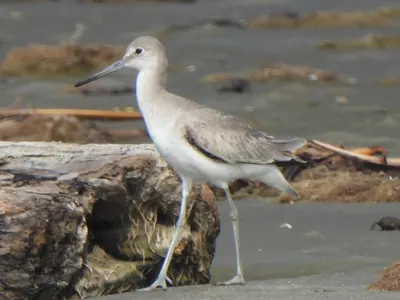 Willet57%
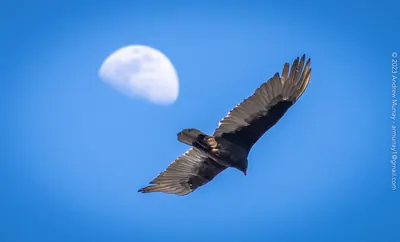 Turkey Vulture54%
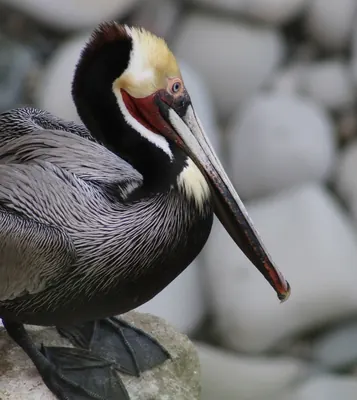 Brown Pelican51%
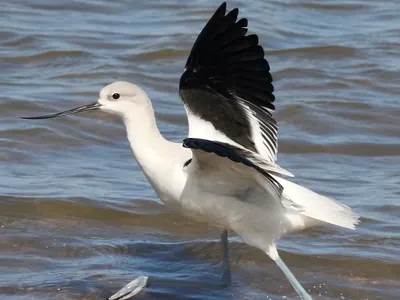 American Avocet49%
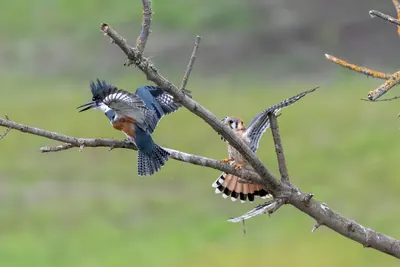 Belted Kingfisher49%
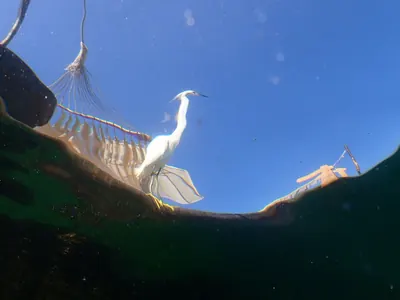 Snowy Egret49%
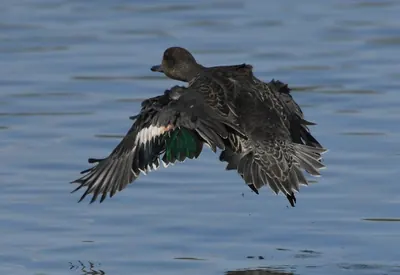 Green-winged Teal48%