Birding spot · Sonoma County, California
Birding at Johnson Gulch: What You'll See Each Week
In November, the birds most often reported at Johnson Gulch are Western Gull (93%), American Coot (76%), and Double-crested Cormorant (76%). It is busiest in winter, when 60 species turn up on at least 1 in 20 checklists, and species counts peak in late April (79 species). 142 species have been reported here across 973 complete checklists from 392 birders.
Species by week
In November: what to expect
- 1
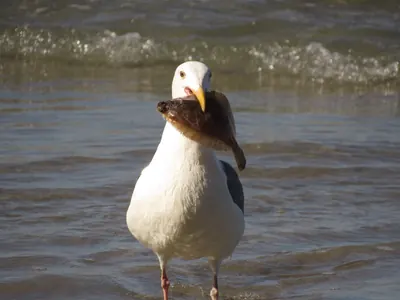 Western Gull93%
- 2
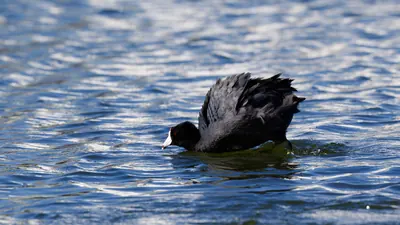 American Coot76%
- 3
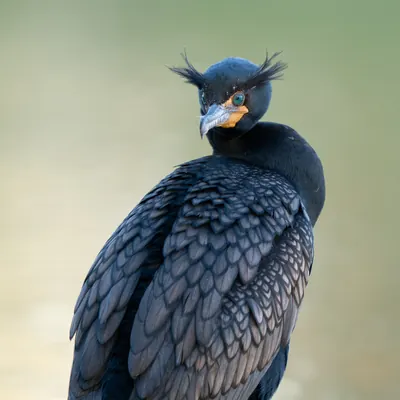 Double-crested Cormorant76%
- 4
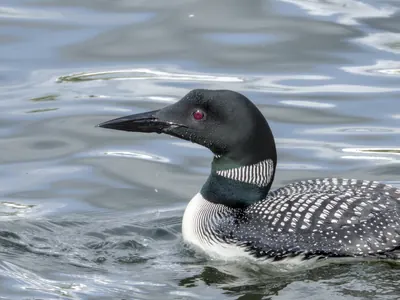 Common Loon63%
- 5
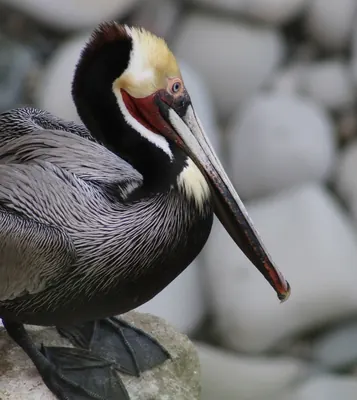 Brown Pelican59%
- 6
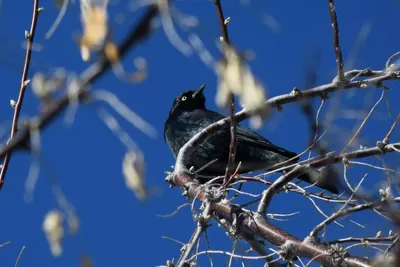 Brewer's Blackbird56%
- 7
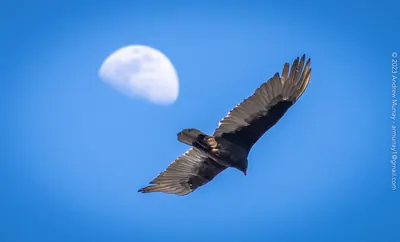 Turkey Vulture51%
- 8
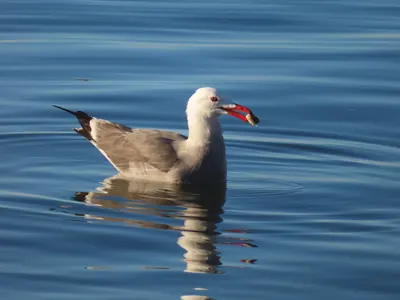 Heermann's Gull48%
- 9
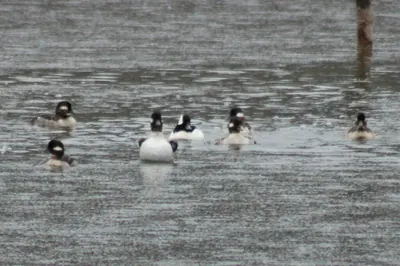 Bufflehead46%
- 10
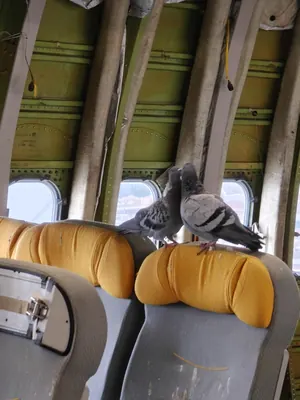 Rock Pigeon46%
- 11
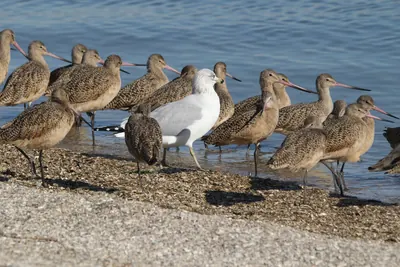 Ring-billed Gull44%
- 12
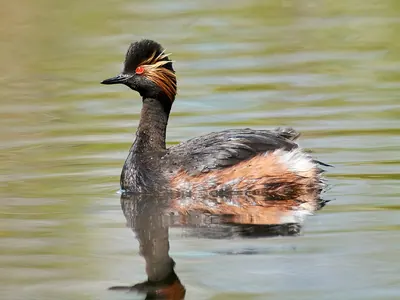 Eared Grebe42%
- 13
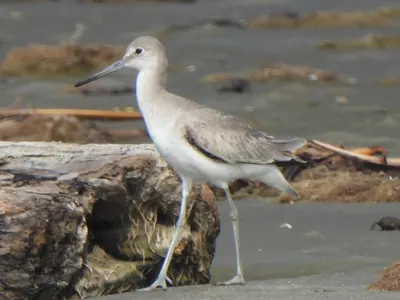 Willet41%
- 14
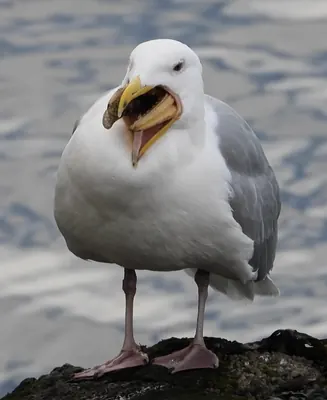 Glaucous-winged Gull37%
- 15
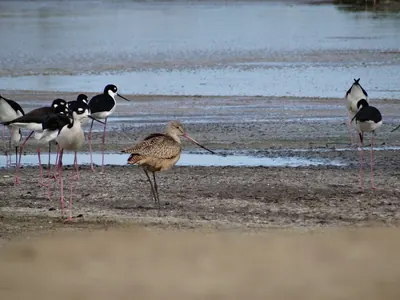 Marbled Godwit37%
Share of complete checklists at this spot that reported the bird in November. The sparkline is the whole year, with this month highlighted.
Season by season
Winter 60 species
- Western Gull87%
- American Coot69%
- Common Loon68%
- Bufflehead67%
- Turkey Vulture52%
Spring 60 species
Summer 40 species
Fall 52 species
Specialties
Birds reported far more often here than across California.
- Ruddy Turnstone
- Common Loon
- Brant
- Short-billed Gull
- Horned Grebe
- Black Turnstone
- Red-breasted Merganser
- Glaucous-winged Gull
Nearby spots
- Bodega Harbor (Bodega Bay) (1.0 km)
- Bodega Harbor (1.1 km)
- Doran Park (Cheney Gulch) (1.8 km)
- Bodega Marine Reserve (2.1 km)
- Doran Park (2.2 km)
- Campbell Cove (Bodega Head) (2.8 km)
Frequency is the share of complete checklists at this location that listed the bird, 2016–2025. Busy places report more of everything, and the weekly chart counts species on at least 5% of checklists so a few stray reports do not inflate it. How to read it.