WhenToBird

Birding spot · Shasta County, California

Birding at Manzanita Lake: What You'll See Each Week

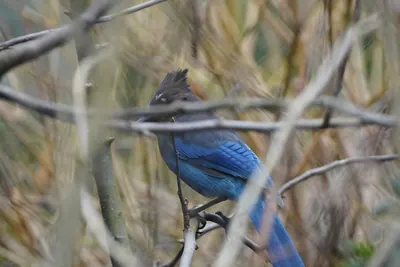
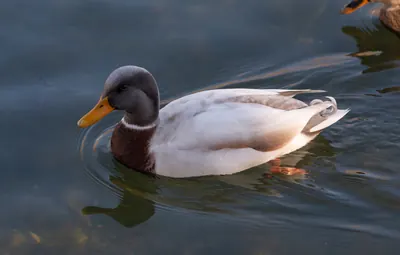
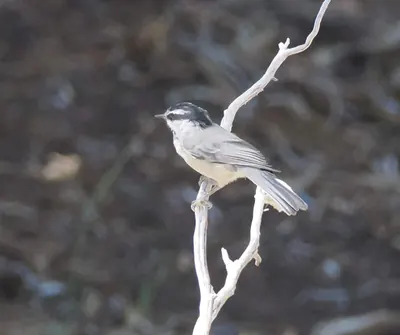
In November, the birds most often reported at Manzanita Lake are Steller's Jay (83%), Mallard (76%), and Mountain Chickadee (72%). It is busiest in summer, when 57 species turn up on at least 1 in 20 checklists, and species counts peak in mid July (66 species). 142 species have been reported here across 927 complete checklists from 540 birders.

Species by week

020406080Jan 1-7: low data (2 checklists)Jan 8-14: low data (1 checklists)Jan 15-21: low data (3 checklists)Jan 22-31: low data (1 checklists)Feb 1-7: low data (0 checklists)Feb 8-14: low data (2 checklists)Feb 15-21: low data (2 checklists)Feb 22-28: low data (0 checklists)Mar 1-7: low data (0 checklists)Mar 8-14: low data (0 checklists)Mar 15-21: low data (1 checklists)Mar 22-31: low data (1 checklists)Apr 1-7: low data (1 checklists)Apr 8-14: low data (2 checklists)Apr 15-21: 31 species on 5%+ of 10 checklistsApr 22-30: low data (8 checklists)May 1-7: low data (5 checklists)May 8-14: 53 species on 5%+ of 13 checklistsMay 15-21: 51 species on 5%+ of 10 checklistsMay 22-31: 49 species on 5%+ of 43 checklistsJun 1-7: 48 species on 5%+ of 28 checklistsJun 8-14: 50 species on 5%+ of 53 checklistsJun 15-21: 56 species on 5%+ of 59 checklistsJun 22-30: 57 species on 5%+ of 78 checklistsJul 1-7: 59 species on 5%+ of 54 checklistsJul 8-14: 59 species on 5%+ of 54 checklistsJul 15-21: 66 species on 5%+ of 39 checklistsJul 22-31: 54 species on 5%+ of 81 checklistsAug 1-7: 52 species on 5%+ of 51 checklistsAug 8-14: 57 species on 5%+ of 48 checklistsAug 15-21: 59 species on 5%+ of 31 checklistsAug 22-31: 53 species on 5%+ of 53 checklistsSep 1-7: 64 species on 5%+ of 33 checklistsSep 8-14: 53 species on 5%+ of 29 checklistsSep 15-21: 57 species on 5%+ of 14 checklistsSep 22-30: 46 species on 5%+ of 22 checklistsOct 1-7: 61 species on 5%+ of 15 checklistsOct 8-14: 46 species on 5%+ of 24 checklistsOct 15-21: 46 species on 5%+ of 14 checklistsOct 22-31: 52 species on 5%+ of 13 checklistsNov 1-7: low data (9 checklists)Nov 8-14: low data (2 checklists)Nov 15-21: low data (3 checklists)Nov 22-30: low data (7 checklists)Dec 1-7: low data (0 checklists)Dec 8-14: low data (1 checklists)Dec 15-21: low data (1 checklists)Dec 22-31: low data (6 checklists)JanFebMarAprMayJunJulAugSepOctNovDec
Number of species reported on at least 5% of complete checklists, by week (4 per month). Grey bars: fewer than 10 checklists, not counted.

In November: what to expect

  1. 1Steller's Jay83%
  2. 2Mallard76%
  3. 3Mountain Chickadee72%
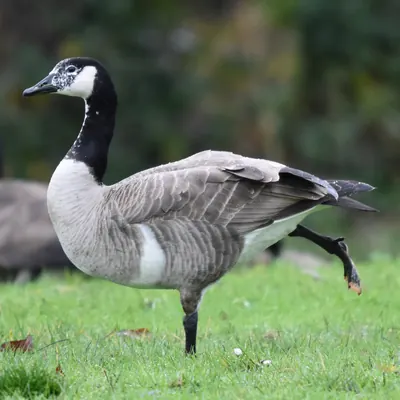
  4. 4Canada Goose71%
  5. 5Common Raven65%
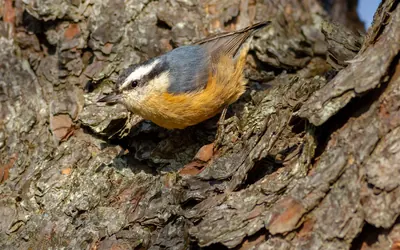
  6. 6Red-breasted Nuthatch65%
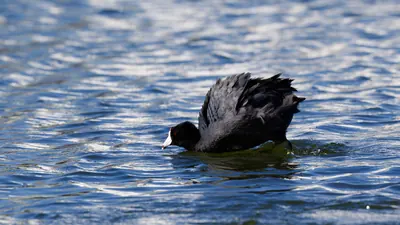
  7. 7American Coot64%
  8. 8Yellow-rumped Warbler62%
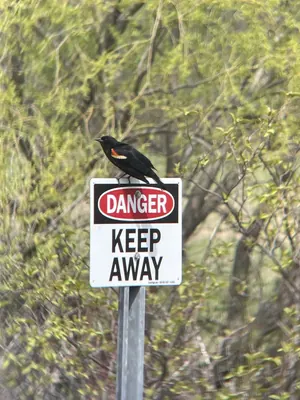
  9. 9Red-winged Blackbird58%
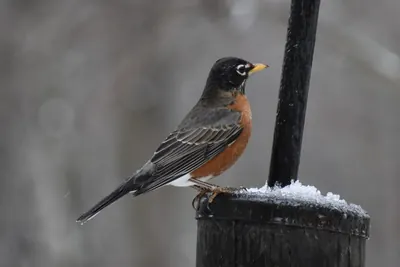
  10. 10American Robin52%
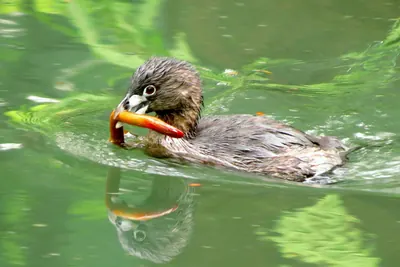
  11. 11Pied-billed Grebe46%
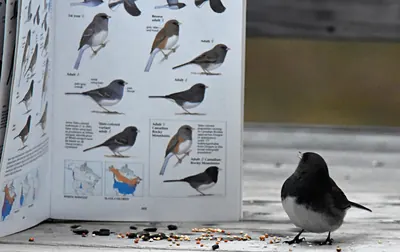
  12. 12Dark-eyed Junco45%
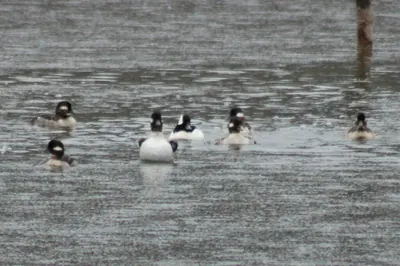
  13. 13Bufflehead45%
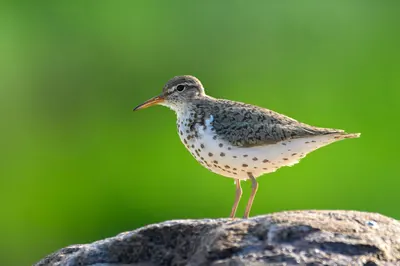
  14. 14Spotted Sandpiper44%
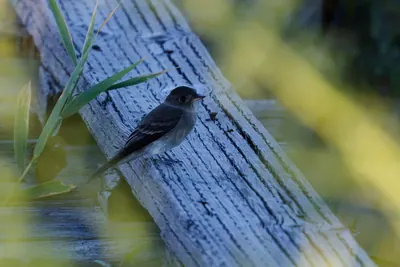
  15. 15Western Wood-Pewee43%

Share of complete checklists at this spot that reported the bird in November. The sparkline is the whole year, with this month highlighted.

Season by season

Specialties

Birds reported far more often here than across California.

Frequency is the share of complete checklists at this location that listed the bird, 2016–2025. Busy places report more of everything, and the weekly chart counts species on at least 5% of checklists so a few stray reports do not inflate it. How to read it.