Birding spot · Marin County, California
Birding at Point Reyes National Seashore: What You'll See Each Week In November, the birds most often reported at Point Reyes National Seashore are Black Phoebe (91%), White-crowned Sparrow (86%), and Western Gull (78%). It is busiest in fall, when 80 species turn up on at least 1 in 20 checklists, and species counts peak in mid October (81 species). 237 species have been reported here across 3,522 complete checklists from 1,253 birders.
Species by week 0 20 40 60 80 100 Jan 1-7: 50 species on 5%+ of 25 checklists Jan 8-14: 75 species on 5%+ of 20 checklists Jan 15-21: 58 species on 5%+ of 26 checklists Jan 22-31: 55 species on 5%+ of 48 checklists Feb 1-7: 64 species on 5%+ of 20 checklists Feb 8-14: 60 species on 5%+ of 18 checklists Feb 15-21: 45 species on 5%+ of 22 checklists Feb 22-28: 55 species on 5%+ of 22 checklists Mar 1-7: 70 species on 5%+ of 13 checklists Mar 8-14: 55 species on 5%+ of 24 checklists Mar 15-21: 53 species on 5%+ of 27 checklists Mar 22-31: 55 species on 5%+ of 25 checklists Apr 1-7: 58 species on 5%+ of 25 checklists Apr 8-14: 56 species on 5%+ of 21 checklists Apr 15-21: 63 species on 5%+ of 42 checklists Apr 22-30: 65 species on 5%+ of 53 checklists May 1-7: 57 species on 5%+ of 47 checklists May 8-14: 67 species on 5%+ of 59 checklists May 15-21: 65 species on 5%+ of 102 checklists May 22-31: 66 species on 5%+ of 230 checklists Jun 1-7: 59 species on 5%+ of 139 checklists Jun 8-14: 53 species on 5%+ of 122 checklists Jun 15-21: 53 species on 5%+ of 90 checklists Jun 22-30: 45 species on 5%+ of 73 checklists Jul 1-7: 49 species on 5%+ of 45 checklists Jul 8-14: 48 species on 5%+ of 33 checklists Jul 15-21: 36 species on 5%+ of 22 checklists Jul 22-31: 35 species on 5%+ of 23 checklists Aug 1-7: 48 species on 5%+ of 31 checklists Aug 8-14: 47 species on 5%+ of 44 checklists Aug 15-21: 66 species on 5%+ of 63 checklists Aug 22-31: 64 species on 5%+ of 153 checklists Sep 1-7: 64 species on 5%+ of 166 checklists Sep 8-14: 68 species on 5%+ of 171 checklists Sep 15-21: 77 species on 5%+ of 299 checklists Sep 22-30: 76 species on 5%+ of 426 checklists Oct 1-7: 80 species on 5%+ of 231 checklists Oct 8-14: 76 species on 5%+ of 139 checklists Oct 15-21: 81 species on 5%+ of 113 checklists Oct 22-31: 69 species on 5%+ of 71 checklists Nov 1-7: 69 species on 5%+ of 51 checklists Nov 8-14: 74 species on 5%+ of 38 checklists Nov 15-21: 64 species on 5%+ of 16 checklists Nov 22-30: 70 species on 5%+ of 18 checklists Dec 1-7: 60 species on 5%+ of 21 checklists Dec 8-14: 68 species on 5%+ of 13 checklists Dec 15-21: low data (9 checklists) Dec 22-31: 58 species on 5%+ of 33 checklists Jan Feb Mar Apr May Jun Jul Aug Sep Oct Nov Dec Number of species reported on at least 5% of complete checklists, by week (4 per month). Grey bars: fewer than 10 checklists, not counted. In November: what to expect 1 Black Phoebe 91% 2 White-crowned Sparrow 86% 3 Western Gull 78% 4 Double-crested Cormorant 76% 5 Common Loon 76% 6 Surf Scoter 74% 7 Brown Pelican 71% 8 Turkey Vulture 63% 9 Song Sparrow 61% 10 Common Raven 57% 11 Red-tailed Hawk 52% 12 Ruby-crowned Kinglet 46% 13 Western Grebe 43% 14 Golden-crowned Sparrow 42% 15 American Kestrel 37% Share of complete checklists at this spot that reported the bird in November. The sparkline is the whole year, with this month highlighted.
Season by season Specialties Birds reported far more often here than across California.
Nearby spots Frequency is the share of complete checklists at this location that listed the bird, 2016–2025. Busy places report more of everything, and the weekly chart counts species on at least 5% of checklists so a few stray reports do not inflate it. How to read it .
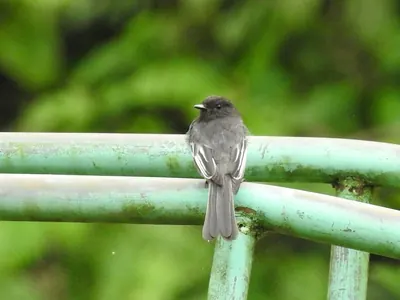 Black Phoebe91%
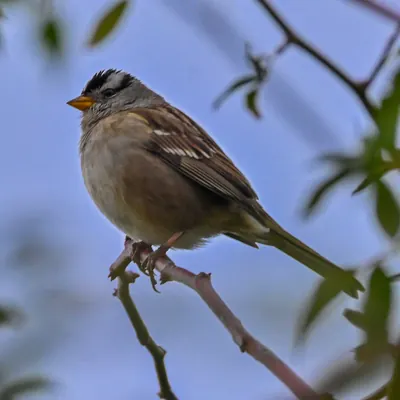 White-crowned Sparrow86%
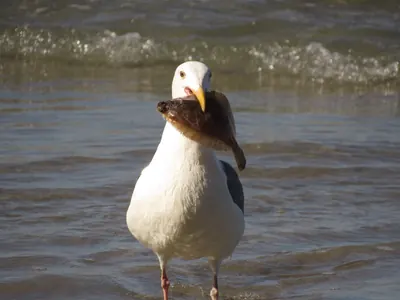 Western Gull78%
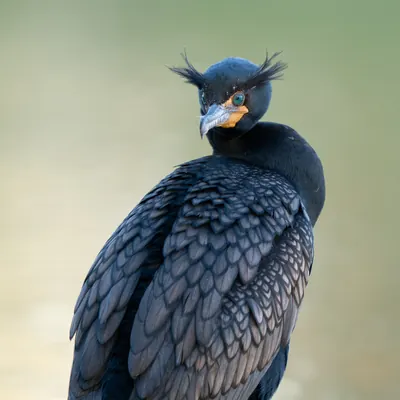 Double-crested Cormorant76%
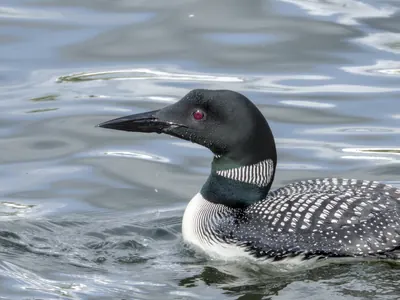 Common Loon76%
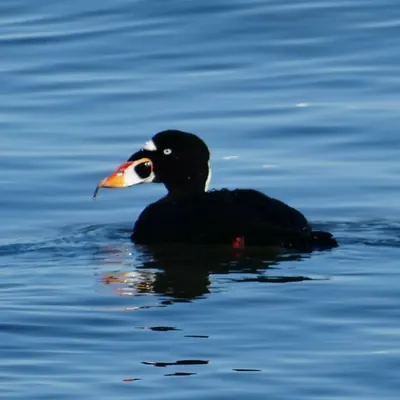 Surf Scoter74%
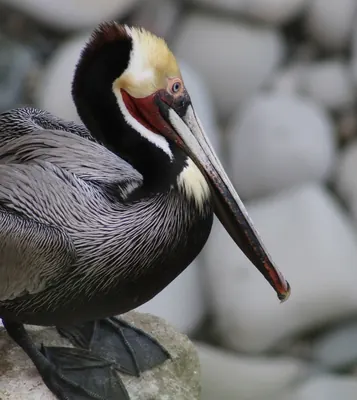 Brown Pelican71%
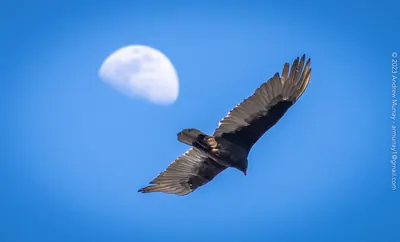 Turkey Vulture63%
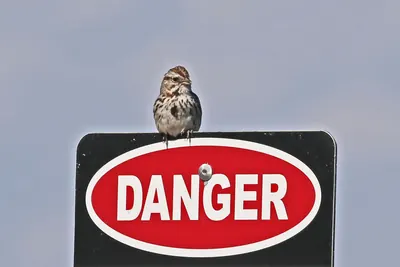 Song Sparrow61%
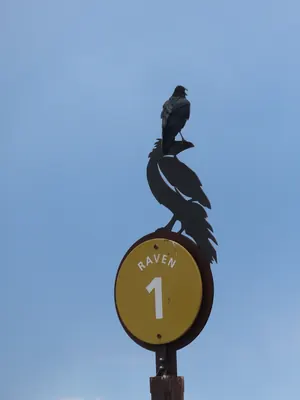 Common Raven57%
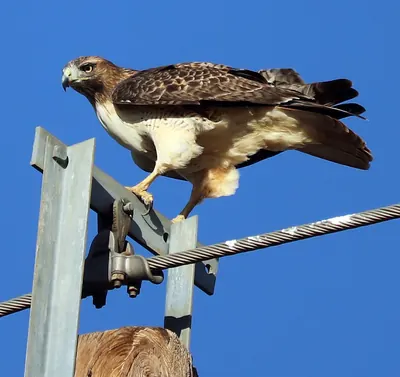 Red-tailed Hawk52%
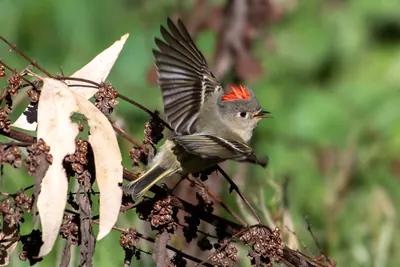 Ruby-crowned Kinglet46%
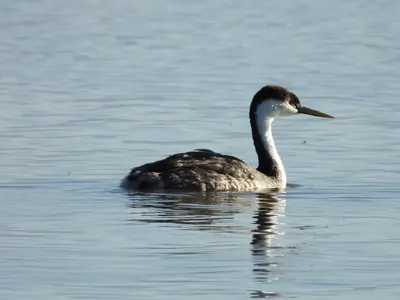 Western Grebe43%
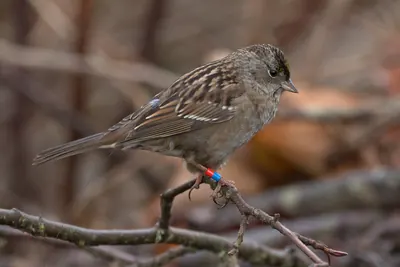 Golden-crowned Sparrow42%
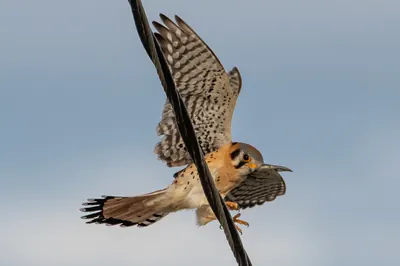 American Kestrel37%