Birding spot · San Diego County, California
Birding at San Diego Bay National Wildlife Refuge: What You'll See Each Week
In November, the birds most often reported at San Diego Bay National Wildlife Refuge are Royal Tern (86%), Willet (83%), and Western Gull (79%). It is busiest in winter, when 85 species turn up on at least 1 in 20 checklists, and species counts peak in early November (91 species). 173 species have been reported here across 1,550 complete checklists from 907 birders.
Species by week
In November: what to expect
- 1
 Royal Tern86%
- 2
 Willet83%
- 3
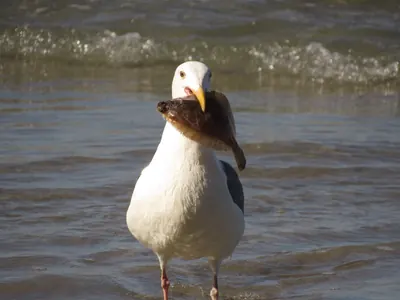 Western Gull79%
- 4
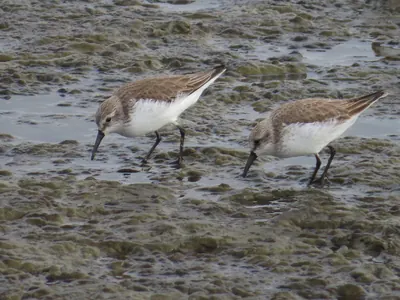 Western Sandpiper70%
- 5
 Black-bellied Plover70%
- 6
 Black-necked Stilt69%
- 7
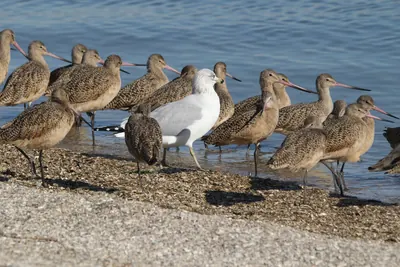 Ring-billed Gull67%
- 8
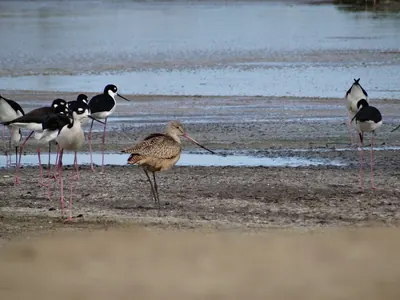 Marbled Godwit63%
- 9
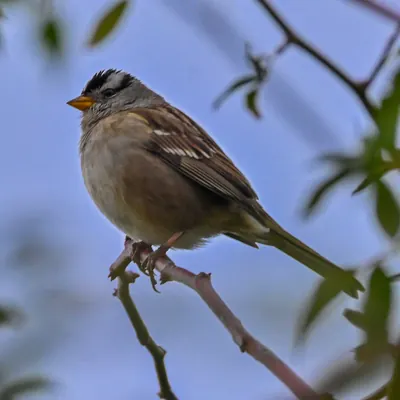 White-crowned Sparrow62%
- 10
 Snowy Egret60%
- 11
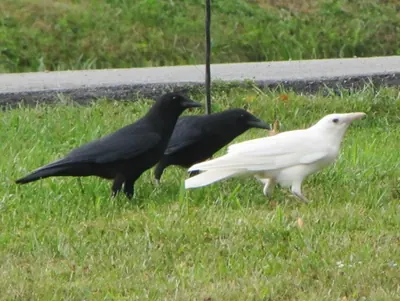 American Crow59%
- 12
 Forster's Tern58%
- 13
 American Wigeon58%
- 14
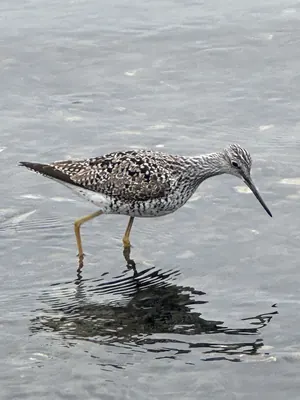 Greater Yellowlegs54%
- 15
 Great Egret53%
Share of complete checklists at this spot that reported the bird in November. The sparkline is the whole year, with this month highlighted.
Season by season
Winter 85 species
- Royal Tern87%
- Western Gull84%
- Willet82%
- American Wigeon76%
- Ring-billed Gull76%
Spring 82 species
Summer 55 species
- Snowy Egret68%
- Willet66%
- Cliff Swallow65%
- Black Skimmer60%
- Elegant Tern60%
Fall 78 species
Specialties
Birds reported far more often here than across California.
- Little Stint
- Gull-billed Tern
- Red Knot
- Pacific Golden-Plover
- Royal Tern
- Ruddy Turnstone
- Black Skimmer
- Short-billed Dowitcher
Nearby spots
- San Diego Bay National Wildlife Refuge (Imperial Beach) (0.7 km)
- South Bay Marine Biological Study Area (1.6 km)
- Tijuana Slough National Wildlife Refuge (2.1 km)
- Tijuana Slough National Wildlife Refuge (Oneonta Slough) (3.2 km)
- Chula Vista Bayfront Park (3.3 km)
- Tijuana River Valley Regional Park (north) (4.6 km)
Frequency is the share of complete checklists at this location that listed the bird, 2016–2025. Busy places report more of everything, and the weekly chart counts species on at least 5% of checklists so a few stray reports do not inflate it. How to read it.