Birding spot · Los Angeles County, California
Birding at Sand Dune Park: What You'll See Each Week
In November, the birds most often reported at Sand Dune Park are American Crow (94%), Black Phoebe (87%), and White-crowned Sparrow (87%). It is busiest in spring, when 57 species turn up on at least 1 in 20 checklists, and species counts peak in late September (62 species). 122 species have been reported here across 915 complete checklists from 245 birders.
Species by week
In November: what to expect
- 1
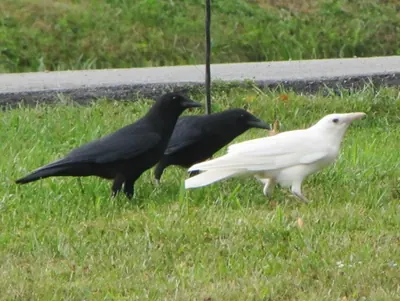 American Crow94%
- 2
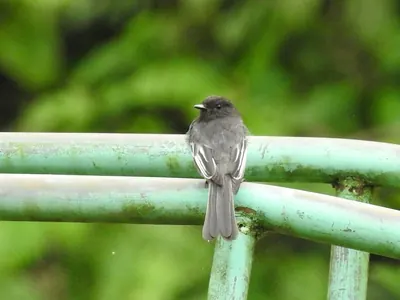 Black Phoebe87%
- 3
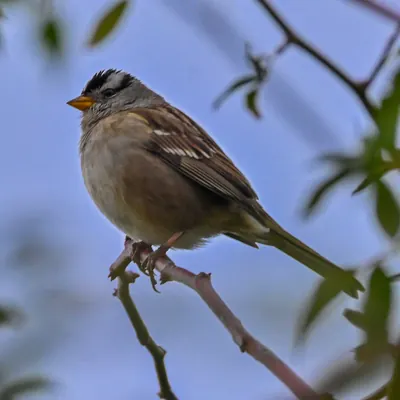 White-crowned Sparrow87%
- 4
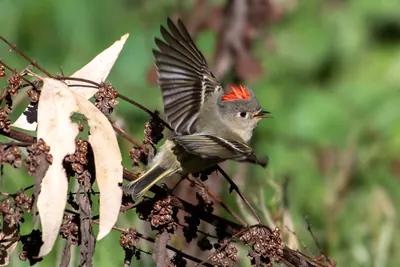 Ruby-crowned Kinglet81%
- 5
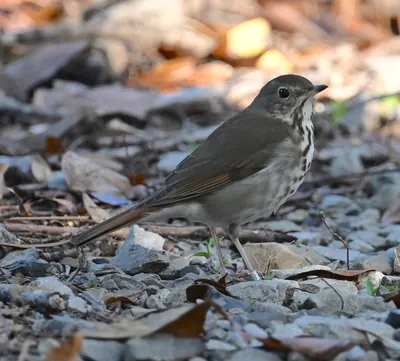 Hermit Thrush77%
- 6
 Yellow-rumped Warbler77%
- 7
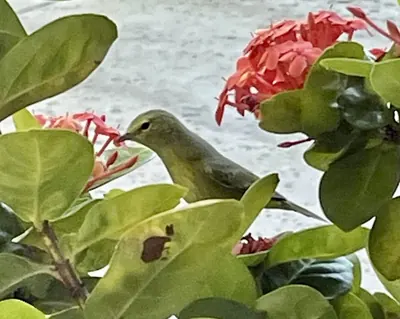 Orange-crowned Warbler74%
- 8
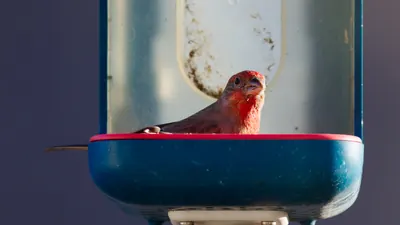 House Finch71%
- 9
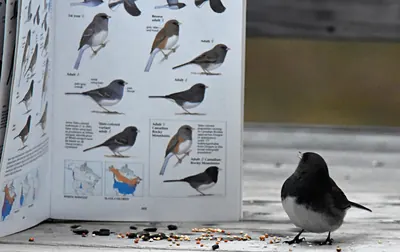 Dark-eyed Junco65%
- 10
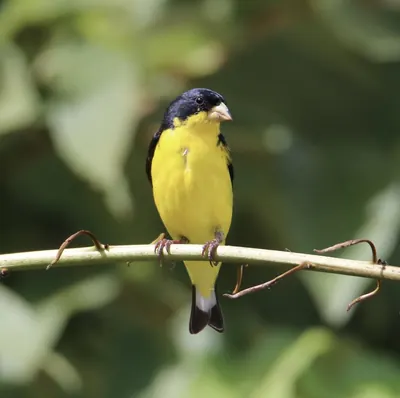 Lesser Goldfinch65%
- 11
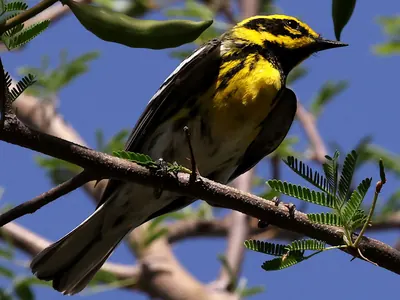 Townsend's Warbler55%
- 12
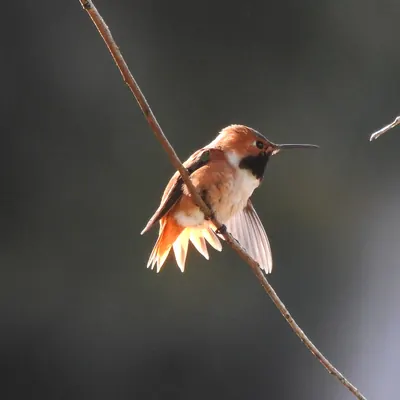 Allen's Hummingbird52%
- 13Northern House Wren42%
- 14
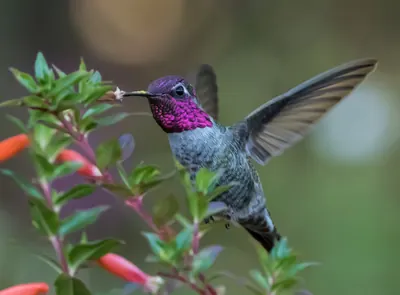 Anna's Hummingbird39%
- 15
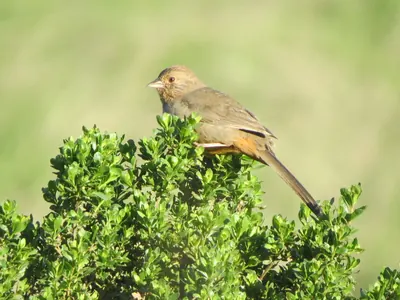 California Towhee35%
Share of complete checklists at this spot that reported the bird in November. The sparkline is the whole year, with this month highlighted.
Season by season
Winter 41 species
Spring 57 species
Summer 43 species
Fall 56 species
Specialties
Birds reported far more often here than across California.
- Hooded Warbler
- Mitred Parakeet
- Willow Flycatcher
- Nashville Warbler
- Hermit Warbler
- Lazuli Bunting
- Olive-sided Flycatcher
- Western Tanager
Nearby spots
- Polliwog Park (2.7 km)
- Entradero Park (6.2 km)
- Del Rey Lagoon Park (7.8 km)
- Ballona Creek Trail and Bike Path (8.0 km)
- Ballona Wetlands Ecological Reserve (8.1 km)
- Del Rey Lagoon (8.3 km)
Frequency is the share of complete checklists at this location that listed the bird, 2016–2025. Busy places report more of everything, and the weekly chart counts species on at least 5% of checklists so a few stray reports do not inflate it. How to read it.