Birding spot · Orange County, California
Birding at Santa Ana River Trail: What You'll See Each Week
In November, the birds most often reported at Santa Ana River Trail are Mallard (100%), American Coot (97%), and Black Phoebe (95%). It is busiest in spring, when 92 species turn up on at least 1 in 20 checklists, and species counts peak in late December (102 species). 162 species have been reported here across 1,289 complete checklists from 464 birders.
Species by week
In November: what to expect
- 1
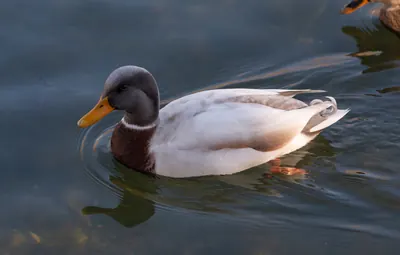 Mallard100%
- 2
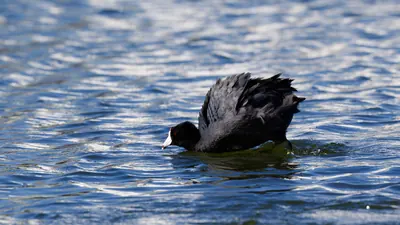 American Coot97%
- 3
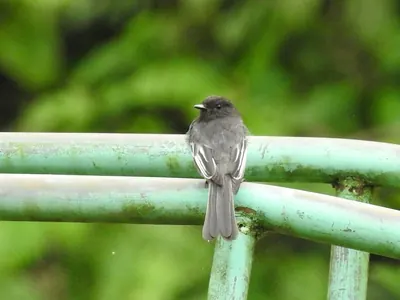 Black Phoebe95%
- 4
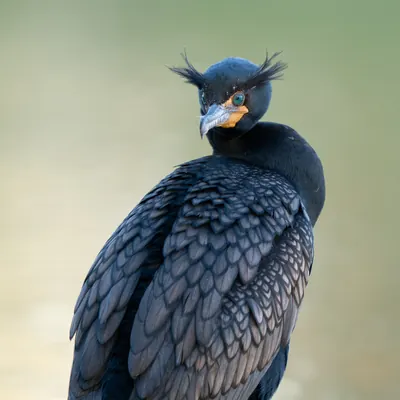 Double-crested Cormorant89%
- 5
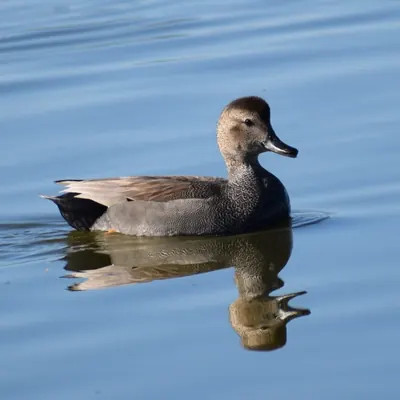 Gadwall89%
- 6
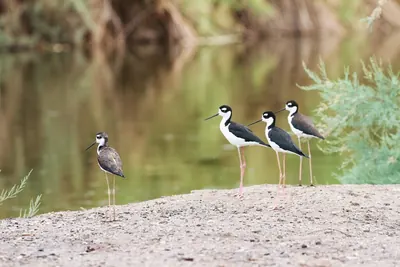 Black-necked Stilt86%
- 7
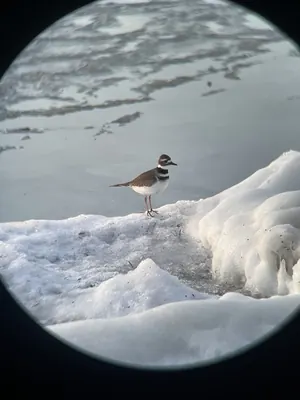 Killdeer86%
- 8
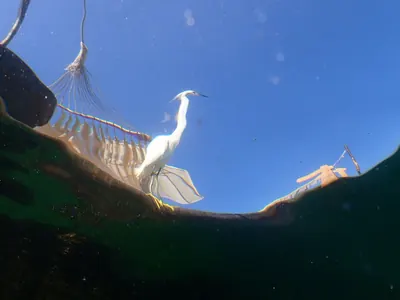 Snowy Egret86%
- 9
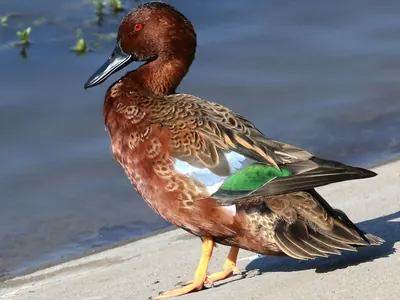 Cinnamon Teal84%
- 10
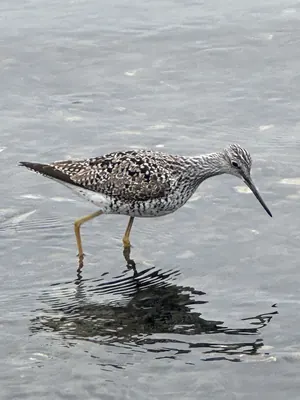 Greater Yellowlegs84%
- 11
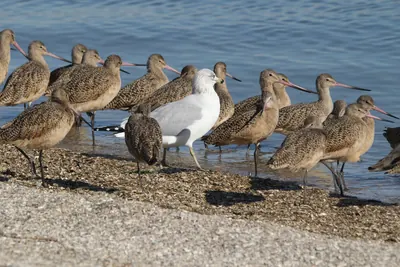 Ring-billed Gull84%
- 12
 Great Egret81%
- 13
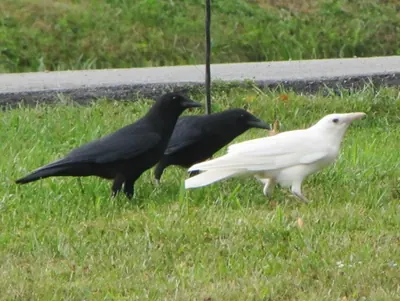 American Crow78%
- 14
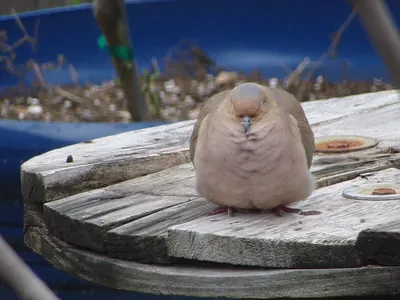 Mourning Dove78%
- 15
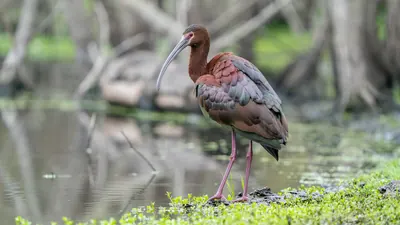 White-faced Ibis78%
Share of complete checklists at this spot that reported the bird in November. The sparkline is the whole year, with this month highlighted.
Season by season
Winter 86 species
- Mallard97%
- American Coot96%
- Gadwall91%
- Black Phoebe91%
- Killdeer84%
Spring 92 species
- Mallard97%
- Killdeer93%
- Black Phoebe92%
- Black-necked Stilt90%
- Gadwall89%
Summer 81 species
- Mallard96%
- Snowy Egret95%
- Killdeer94%
- Black-necked Stilt93%
- Great Egret92%
Fall 91 species
- Mallard95%
- Snowy Egret91%
- Black Phoebe89%
- Great Egret89%
- Black-necked Stilt88%
Specialties
Birds reported far more often here than across California.
- Ruff
- Northern Red Bishop
- Neotropic Cormorant
- Egyptian Goose
- Lesser Yellowlegs
- White-faced Ibis
- Long-billed Dowitcher
- Wood Duck
Nearby spots
- Yorba Regional Park (3.4 km)
- Fletcher Retarding Basin (7.1 km)
- Carbon Canyon Regional Park (7.8 km)
- Irvine Regional Park (7.9 km)
- Gilman Park (8.6 km)
- Ralph B. Clark Regional Park (16.7 km)
Frequency is the share of complete checklists at this location that listed the bird, 2016–2025. Busy places report more of everything, and the weekly chart counts species on at least 5% of checklists so a few stray reports do not inflate it. How to read it.