Birding spot · Los Angeles County, California
Birding at Santa Fe Dam Recreation Area: What You'll See Each Week
In November, the birds most often reported at Santa Fe Dam Recreation Area are Yellow-rumped Warbler (94%), Black Phoebe (93%), and American Coot (88%). It is busiest in fall, when 105 species turn up on at least 1 in 20 checklists, and species counts peak in mid April (120 species). 212 species have been reported here across 1,659 complete checklists from 575 birders.
Species by week
In November: what to expect
- 1
 Yellow-rumped Warbler94%
- 2
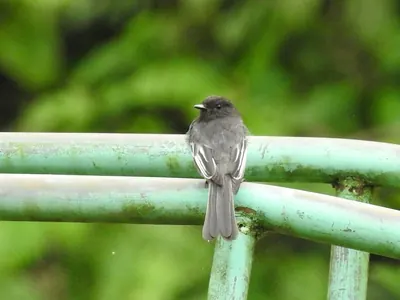 Black Phoebe93%
- 3
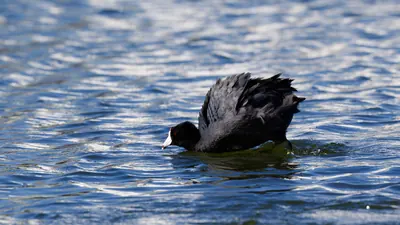 American Coot88%
- 4
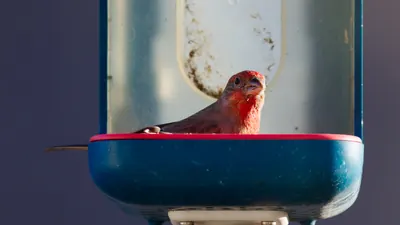 House Finch88%
- 5
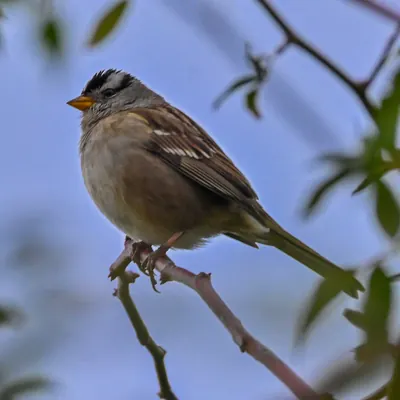 White-crowned Sparrow87%
- 6
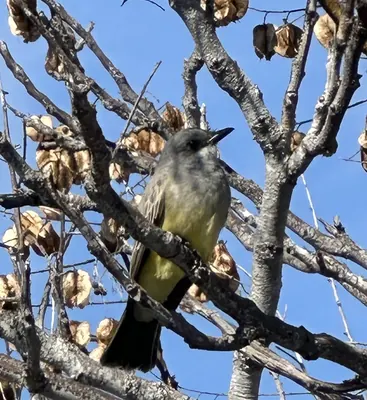 Cassin's Kingbird77%
- 7
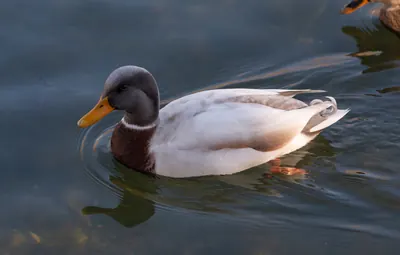 Mallard77%
- 8
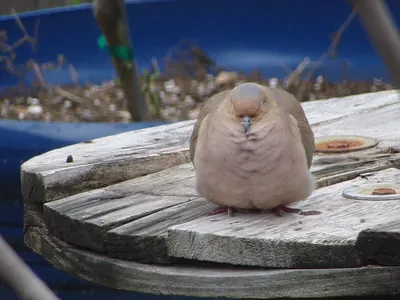 Mourning Dove77%
- 9
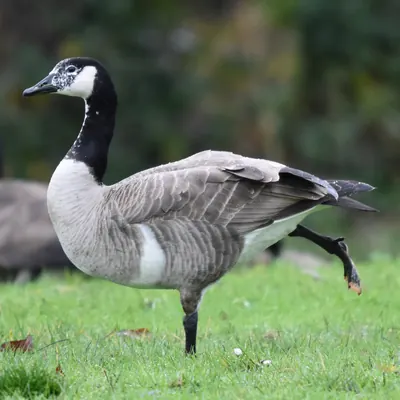 Canada Goose72%
- 10
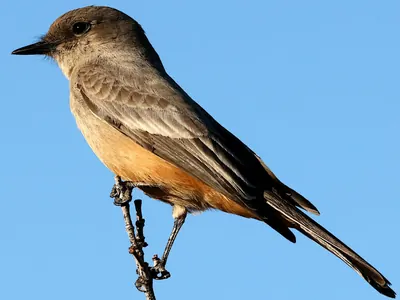 Say's Phoebe68%
- 11
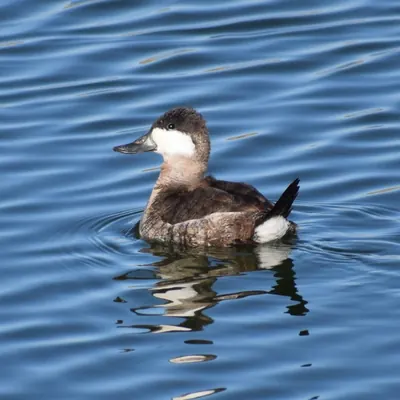 Ruddy Duck63%
- 12
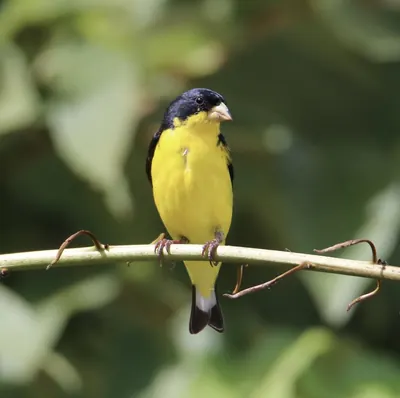 Lesser Goldfinch61%
- 13
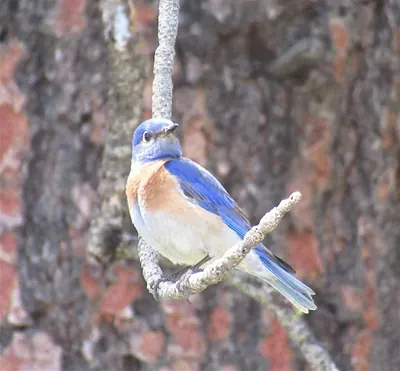 Western Bluebird61%
- 14
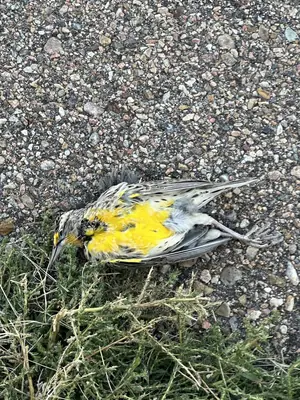 Western Meadowlark61%
- 15
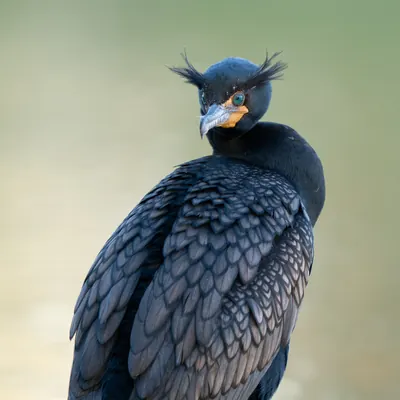 Double-crested Cormorant60%
Share of complete checklists at this spot that reported the bird in November. The sparkline is the whole year, with this month highlighted.
Season by season
Winter 98 species
Spring 104 species
Summer 78 species
- House Finch90%
- Mourning Dove90%
- Black Phoebe87%
- Mallard82%
- Lesser Goldfinch77%
Fall 105 species
Specialties
Birds reported far more often here than across California.
- Ross's Goose
- Graylag Goose
- Neotropic Cormorant
- Vesper Sparrow
- Vermilion Flycatcher
- Snow Goose
- Rock Wren
- Greater White-fronted Goose
Nearby spots
- Peck Road Park (5.9 km)
- Los Angeles County Arboretum and Botanic Garden (10.0 km)
- Legg Lake (13.4 km)
- Viña Vieja Park (13.6 km)
- Frank G Bonelli Regional Park (13.7 km)
- Frank G Bonelli Regional Park (Live Oak Wash) (14.0 km)
Frequency is the share of complete checklists at this location that listed the bird, 2016–2025. Busy places report more of everything, and the weekly chart counts species on at least 5% of checklists so a few stray reports do not inflate it. How to read it.