Birding spot · Sussex County, Delaware
Birding at Cape Henlopen State Park (southeast): What You'll See Each Week
In November, the birds most often reported at Cape Henlopen State Park (southeast) are Double-crested Cormorant (81%), Great Black-backed Gull (81%), and Northern Gannet (75%). It is busiest in spring, when 74 species turn up on at least 1 in 20 checklists, and species counts peak in early May (89 species). 195 species have been reported here across 1,352 complete checklists from 579 birders.
Species by week
In November: what to expect
- 1
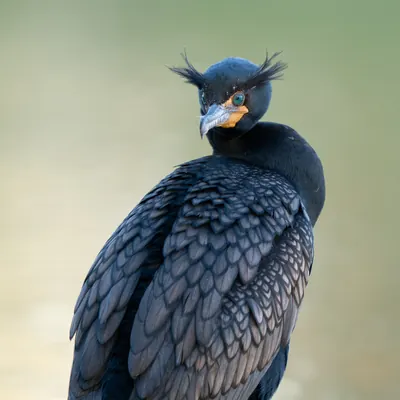 Double-crested Cormorant81%
- 2
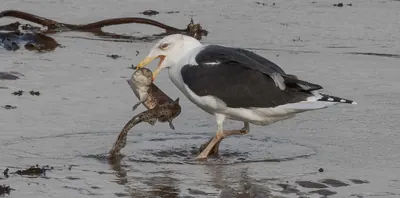 Great Black-backed Gull81%
- 3
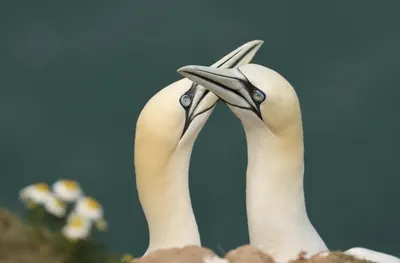 Northern Gannet75%
- 4
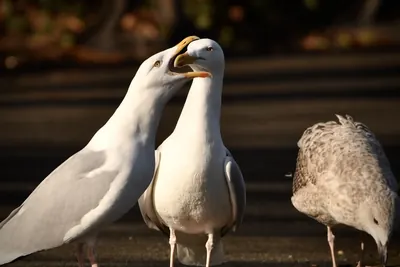 American Herring Gull72%
- 5
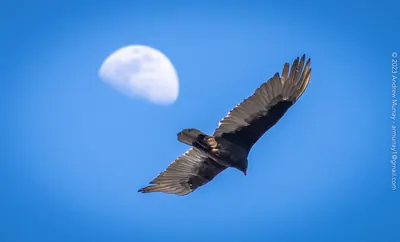 Turkey Vulture71%
- 6
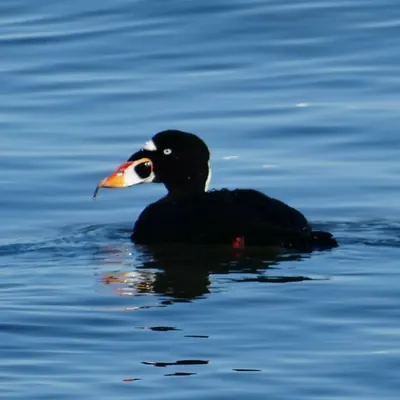 Surf Scoter68%
- 7
 Yellow-rumped Warbler68%
- 8
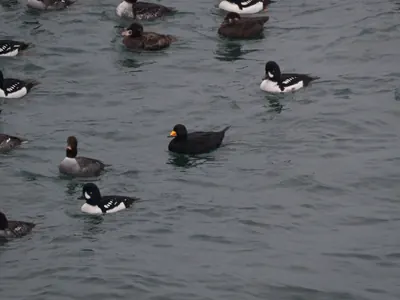 Black Scoter61%
- 9
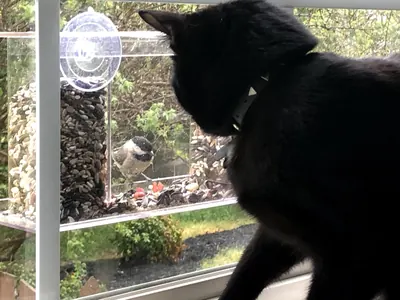 Carolina Chickadee61%
- 10
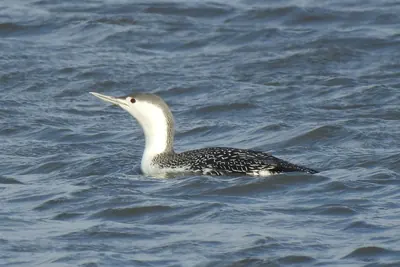 Red-throated Loon61%
- 11
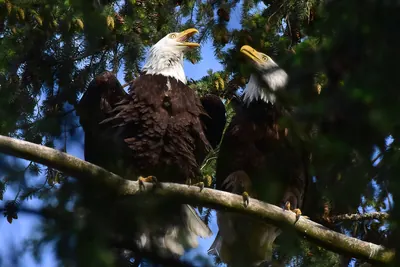 Bald Eagle60%
- 12
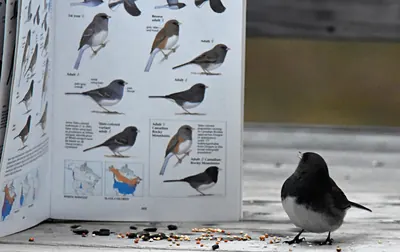 Dark-eyed Junco53%
- 13
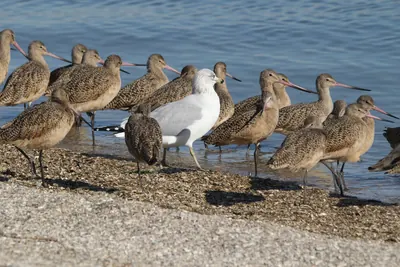 Ring-billed Gull52%
- 14
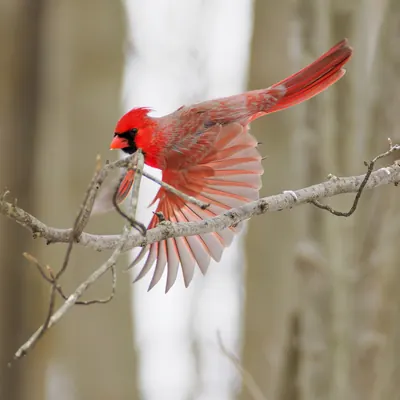 Northern Cardinal49%
- 15
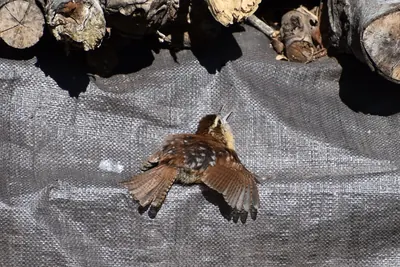 Carolina Wren47%
Share of complete checklists at this spot that reported the bird in November. The sparkline is the whole year, with this month highlighted.
Season by season
Winter 42 species
Spring 74 species
Summer 60 species
Fall 68 species
Specialties
Birds reported far more often here than across Delaware.
- Northern Gannet
- Merlin
- Brown Pelican
- White-winged Scoter
- Black Scoter
- Peregrine Falcon
- Lesser Black-backed Gull
- Royal Tern
Nearby spots
- Cape Henlopen State Park (south) (0.9 km)
- Cape Henlopen State Park (1.3 km)
- Cape Henlopen State Park (south) (1.9 km)
- Cape Henlopen State Park (southeast) (2.6 km)
- Rehoboth Flats (4.0 km)
- Silver Lake (9.0 km)
Frequency is the share of complete checklists at this location that listed the bird, 2016–2025. Busy places report more of everything, and the weekly chart counts species on at least 5% of checklists so a few stray reports do not inflate it. How to read it.