Birding spot · Wakulla County, Florida
Birding at East River Pool (northwest): What You'll See Each Week
In November, the birds most often reported at East River Pool (northwest) are Great Egret (74%), Boat-tailed Grackle (68%), and Great Blue Heron (64%). It is busiest in spring, when 72 species turn up on at least 1 in 20 checklists, and species counts peak in mid April (96 species). 188 species have been reported here across 1,098 complete checklists from 635 birders.
Species by week
In November: what to expect
- 1
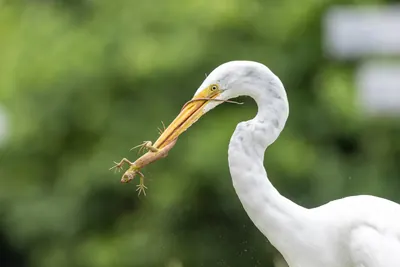 Great Egret74%
- 2
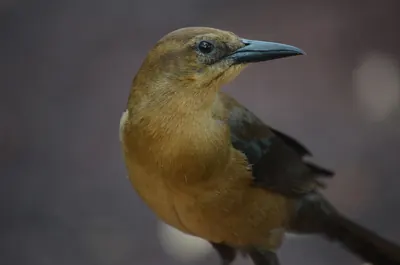 Boat-tailed Grackle68%
- 3
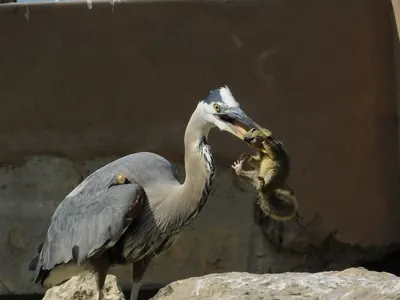 Great Blue Heron64%
- 4
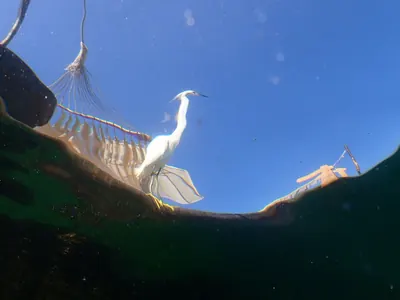 Snowy Egret60%
- 5
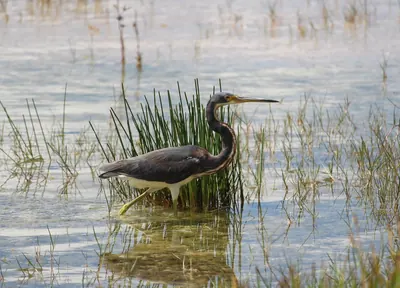 Tricolored Heron59%
- 6
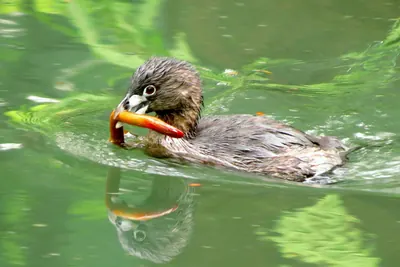 Pied-billed Grebe57%
- 7
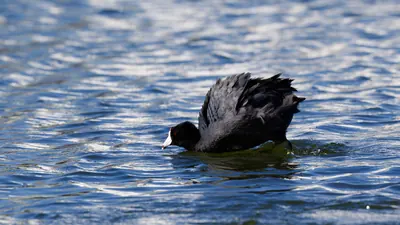 American Coot56%
- 8
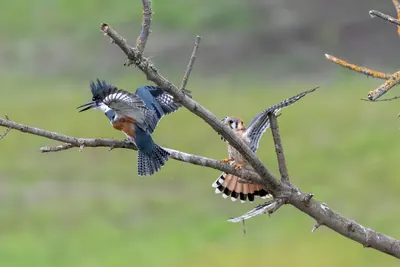 Belted Kingfisher56%
- 9
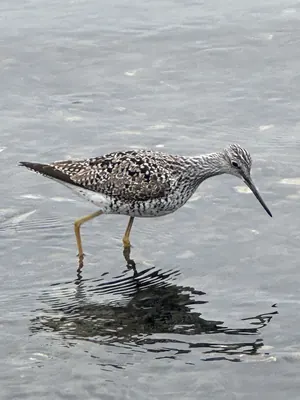 Greater Yellowlegs56%
- 10
 Killdeer50%
- 11
 Eastern Phoebe47%
- 12
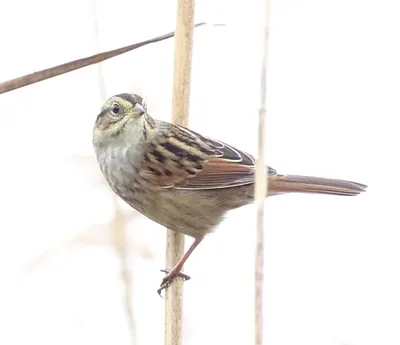 Swamp Sparrow46%
- 13
 Yellow-rumped Warbler46%
- 14
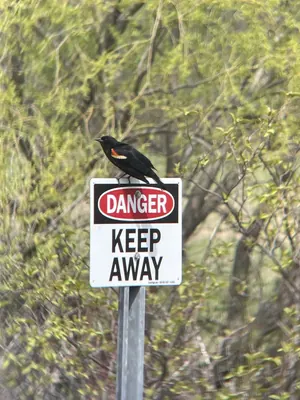 Red-winged Blackbird45%
- 15
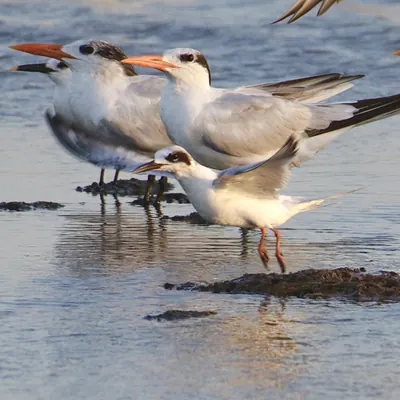 Forster's Tern43%
Share of complete checklists at this spot that reported the bird in November. The sparkline is the whole year, with this month highlighted.
Season by season
Winter 69 species
Spring 72 species
Summer 59 species
Fall 71 species
Specialties
Birds reported far more often here than across Florida.
- American Golden-Plover
- American Flamingo
- Vermilion Flycatcher
- Green-winged Teal
- American Avocet
- Gadwall
- Bufflehead
- Wilson's Snipe
Nearby spots
- East River Pool (0.8 km)
- St. Marks National Wildlife Refuge (2.2 km)
- Headquarters Pond (5.0 km)
- Mounds Pond (5.1 km)
- Lighthouse Pool (7.1 km)
- Wakulla Springs (18.8 km)
Frequency is the share of complete checklists at this location that listed the bird, 2016–2025. Busy places report more of everything, and the weekly chart counts species on at least 5% of checklists so a few stray reports do not inflate it. How to read it.