Birding spot · Brevard County, Florida
Birding at St. Sebastian River Preserve State Park: What You'll See Each Week
In November, the birds most often reported at St. Sebastian River Preserve State Park are American Kestrel (94%), Eastern Phoebe (66%), and Red-bellied Woodpecker (66%). It is busiest in winter, when 57 species turn up on at least 1 in 20 checklists, and species counts peak in mid January (66 species). 120 species have been reported here across 827 complete checklists from 434 birders.
Species by week
In November: what to expect
- 1
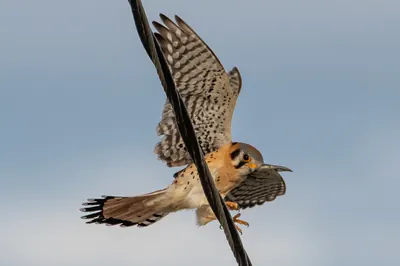 American Kestrel94%
- 2
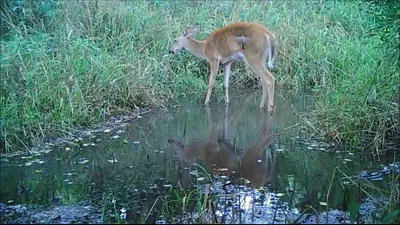 Eastern Phoebe66%
- 3
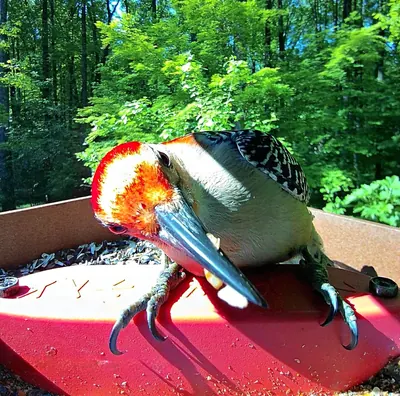 Red-bellied Woodpecker66%
- 4
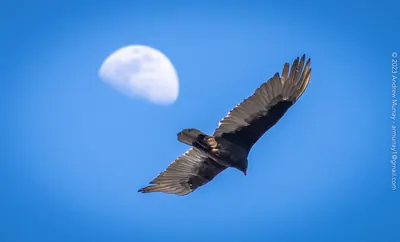 Turkey Vulture59%
- 5
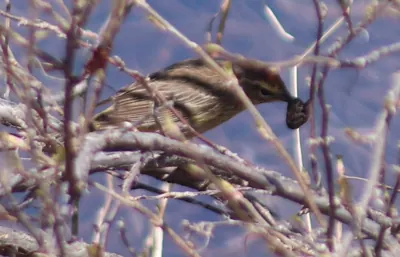 Palm Warbler50%
- 6
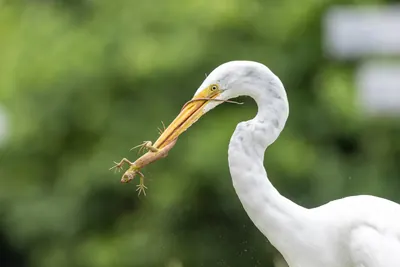 Great Egret47%
- 7
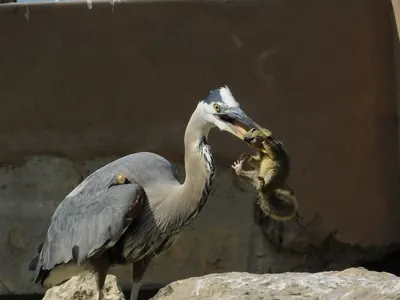 Great Blue Heron44%
- 8
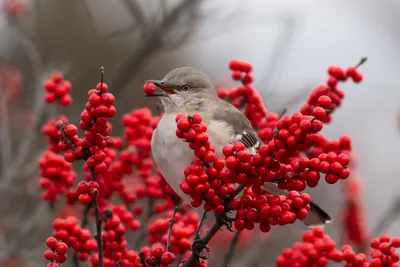 Northern Mockingbird44%
- 9
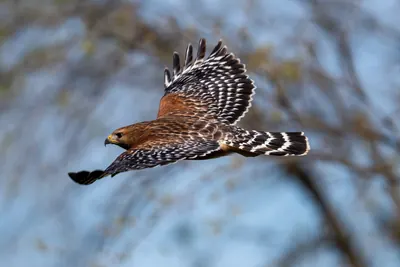 Red-shouldered Hawk44%
- 10
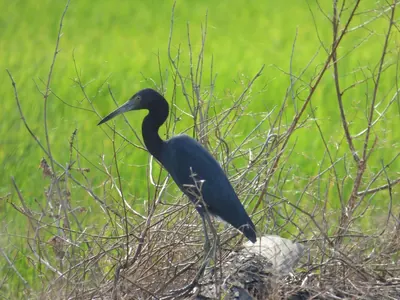 Little Blue Heron41%
- 11
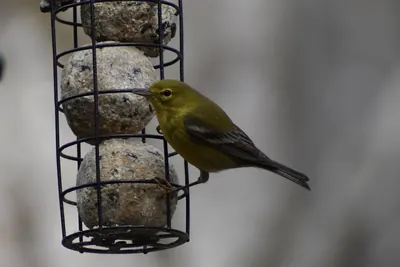 Pine Warbler41%
- 12
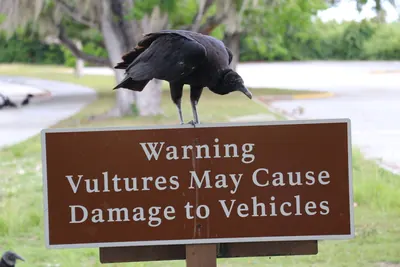 Black Vulture38%
- 13
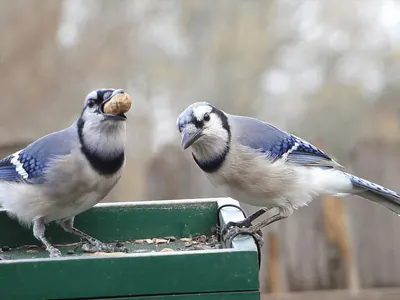 Blue Jay38%
- 14
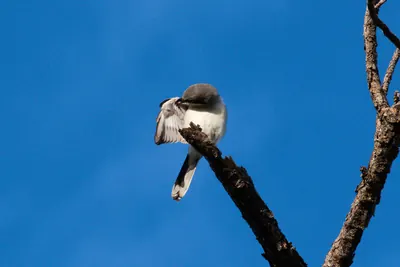 Loggerhead Shrike38%
- 15
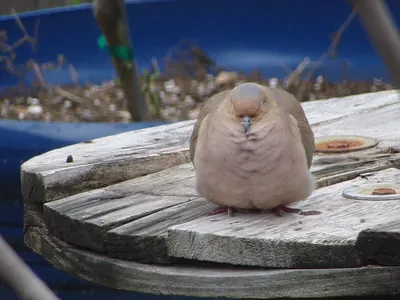 Mourning Dove38%
Share of complete checklists at this spot that reported the bird in November. The sparkline is the whole year, with this month highlighted.
Season by season
Winter 57 species
Spring 55 species
Summer 54 species
Fall 53 species
Specialties
Birds reported far more often here than across Florida.
- Red-cockaded Woodpecker
- Bachman's Sparrow
- Brown-headed Nuthatch
- Wild Turkey
- American Kestrel
- Pine Warbler
- Eastern Meadowlark
- Northern Bobwhite
Nearby spots
- Sebastian Inlet State Park (15.9 km)
- Sebastian Inlet State Park (Orchid Island) (15.9 km)
- Turkey Creek Sanctuary (21.1 km)
Frequency is the share of complete checklists at this location that listed the bird, 2016–2025. Busy places report more of everything, and the weekly chart counts species on at least 5% of checklists so a few stray reports do not inflate it. How to read it.