Birding spot · Porter County, Indiana
Birding at Reynold's Creek Gamebird Habitat Area: What You'll See Each Week
In November, the birds most often reported at Reynold's Creek Gamebird Habitat Area are Northern Harrier (63%), Red-tailed Hawk (40%), and American Crow (39%). It is busiest in summer, when 58 species turn up on at least 1 in 20 checklists, and species counts peak in the second week of June (67 species). 153 species have been reported here across 917 complete checklists from 287 birders.
Species by week
In November: what to expect
- 1Northern Harrier63%
- 2
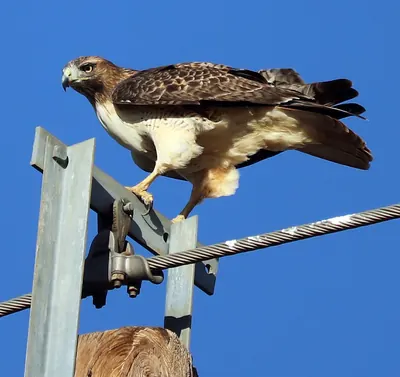 Red-tailed Hawk40%
- 3
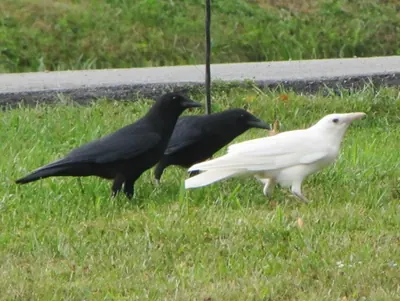 American Crow39%
- 4
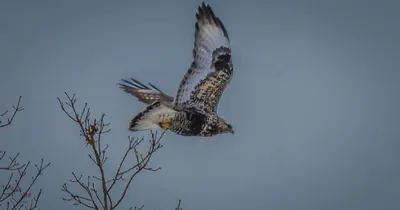 Rough-legged Hawk37%
- 5
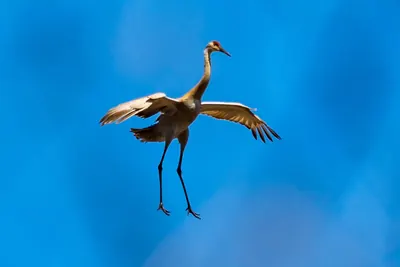 Sandhill Crane36%
- 6
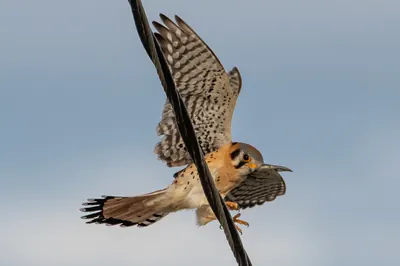 American Kestrel33%
- 7
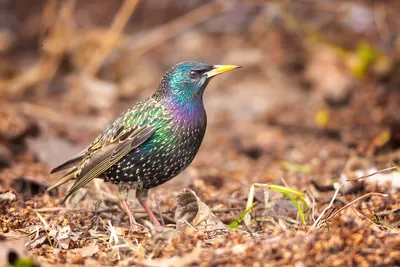 European Starling27%
- 8
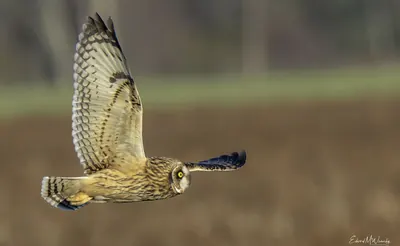 Short-eared Owl27%
- 9
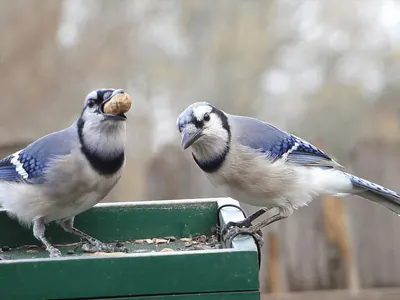 Blue Jay25%
- 10
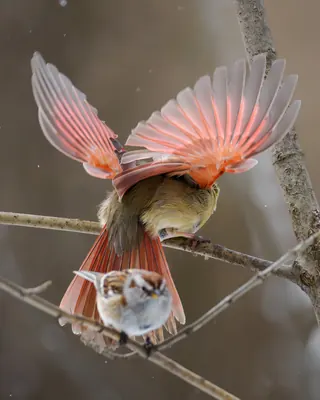 American Tree Sparrow21%
- 11
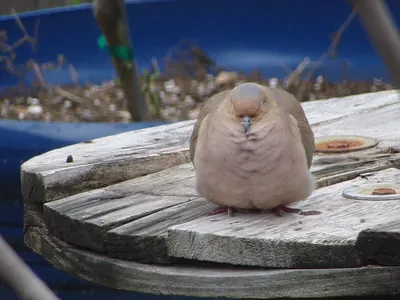 Mourning Dove19%
- 12
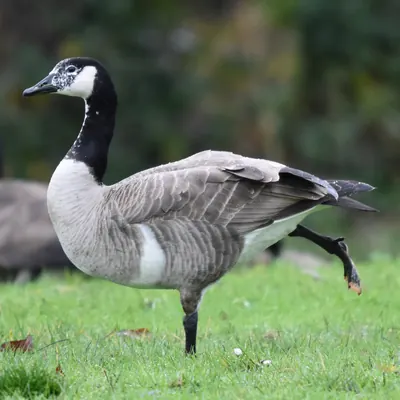 Canada Goose15%
- 13
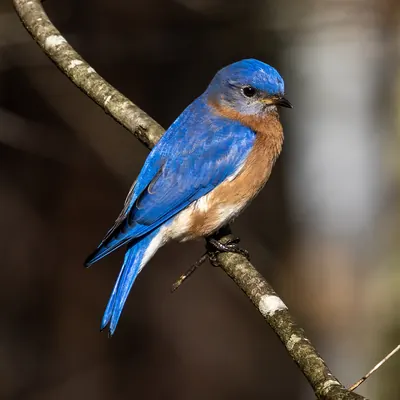 Eastern Bluebird15%
- 14
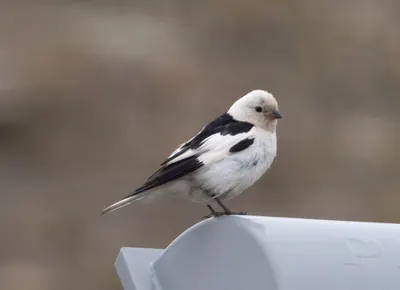 Snow Bunting15%
- 15
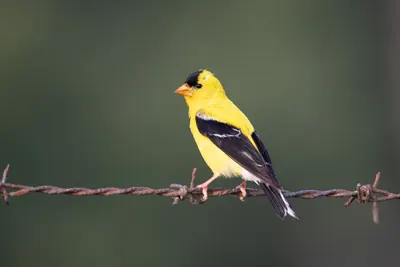 American Goldfinch13%
Share of complete checklists at this spot that reported the bird in November. The sparkline is the whole year, with this month highlighted.
Season by season
Winter 23 species
Spring 57 species
Summer 58 species
Fall 40 species
Specialties
Birds reported far more often here than across Indiana.
- Western Meadowlark
- Brewer's Blackbird
- Short-eared Owl
- Bobolink
- Grasshopper Sparrow
- Rough-legged Hawk
- Northern Harrier
- Savannah Sparrow
Nearby spots
- Indiana Dunes National Park (4.6 km)
- Dunes Nature Preserve (7.5 km)
- Indiana Dunes State Park (Mount Jackson) (8.5 km)
- Washington Park / Michigan City (9.6 km)
- Indiana Dunes State Park (9.9 km)
- Cowles Bog (11.9 km)
Frequency is the share of complete checklists at this location that listed the bird, 2016–2025. Busy places report more of everything, and the weekly chart counts species on at least 5% of checklists so a few stray reports do not inflate it. How to read it.