Birding spot · Ottawa County, Michigan
Birding at Holland State Park (Ottawa Beach): What You'll See Each Week In November, the birds most often reported at Holland State Park (Ottawa Beach) are Ring-billed Gull (97%), American Herring Gull (89%), and Mallard (77%). It is busiest in spring, when 42 species turn up on at least 1 in 20 checklists, and species counts peak in the second week of May (77 species). 211 species have been reported here across 4,726 complete checklists from 944 birders.
Species by week 0 20 40 60 80 Jan 1-7: 24 species on 5%+ of 195 checklists Jan 8-14: 26 species on 5%+ of 115 checklists Jan 15-21: 22 species on 5%+ of 85 checklists Jan 22-31: 23 species on 5%+ of 94 checklists Feb 1-7: 20 species on 5%+ of 63 checklists Feb 8-14: 21 species on 5%+ of 67 checklists Feb 15-21: 23 species on 5%+ of 81 checklists Feb 22-28: 23 species on 5%+ of 74 checklists Mar 1-7: 29 species on 5%+ of 232 checklists Mar 8-14: 32 species on 5%+ of 87 checklists Mar 15-21: 30 species on 5%+ of 47 checklists Mar 22-31: 31 species on 5%+ of 75 checklists Apr 1-7: 31 species on 5%+ of 52 checklists Apr 8-14: 36 species on 5%+ of 45 checklists Apr 15-21: 38 species on 5%+ of 63 checklists Apr 22-30: 51 species on 5%+ of 69 checklists May 1-7: 43 species on 5%+ of 54 checklists May 8-14: 77 species on 5%+ of 69 checklists May 15-21: 69 species on 5%+ of 67 checklists May 22-31: 56 species on 5%+ of 85 checklists Jun 1-7: 44 species on 5%+ of 70 checklists Jun 8-14: 36 species on 5%+ of 66 checklists Jun 15-21: 31 species on 5%+ of 34 checklists Jun 22-30: 39 species on 5%+ of 78 checklists Jul 1-7: 43 species on 5%+ of 67 checklists Jul 8-14: 26 species on 5%+ of 62 checklists Jul 15-21: 36 species on 5%+ of 75 checklists Jul 22-31: 39 species on 5%+ of 121 checklists Aug 1-7: 40 species on 5%+ of 96 checklists Aug 8-14: 28 species on 5%+ of 81 checklists Aug 15-21: 24 species on 5%+ of 102 checklists Aug 22-31: 38 species on 5%+ of 143 checklists Sep 1-7: 34 species on 5%+ of 111 checklists Sep 8-14: 26 species on 5%+ of 87 checklists Sep 15-21: 36 species on 5%+ of 108 checklists Sep 22-30: 34 species on 5%+ of 91 checklists Oct 1-7: 31 species on 5%+ of 85 checklists Oct 8-14: 34 species on 5%+ of 100 checklists Oct 15-21: 39 species on 5%+ of 78 checklists Oct 22-31: 34 species on 5%+ of 161 checklists Nov 1-7: 31 species on 5%+ of 151 checklists Nov 8-14: 28 species on 5%+ of 127 checklists Nov 15-21: 23 species on 5%+ of 157 checklists Nov 22-30: 23 species on 5%+ of 237 checklists Dec 1-7: 21 species on 5%+ of 117 checklists Dec 8-14: 29 species on 5%+ of 101 checklists Dec 15-21: 28 species on 5%+ of 73 checklists Dec 22-31: 31 species on 5%+ of 228 checklists Jan Feb Mar Apr May Jun Jul Aug Sep Oct Nov Dec Number of species reported on at least 5% of complete checklists, by week (4 per month). Grey bars: fewer than 10 checklists, not counted. In November: what to expect 1 Ring-billed Gull 97% 2 American Herring Gull 89% 3 Mallard 77% 4 Red-breasted Merganser 71% 5 Great Black-backed Gull 68% 6 Bonaparte's Gull 44% 7 American Crow 38% 8 Long-tailed Duck 35% 9 Purple Sandpiper 27% 10 Common Loon 20% 11 Horned Grebe 19% 12 Snow Bunting 17% 13 White-winged Scoter 16% 14 Double-crested Cormorant 15% 15 House Sparrow 14% Share of complete checklists at this spot that reported the bird in November. The sparkline is the whole year, with this month highlighted.
Season by season Specialties Birds reported far more often here than across Michigan.
Nearby spots Frequency is the share of complete checklists at this location that listed the bird, 2016–2025. Busy places report more of everything, and the weekly chart counts species on at least 5% of checklists so a few stray reports do not inflate it. How to read it .
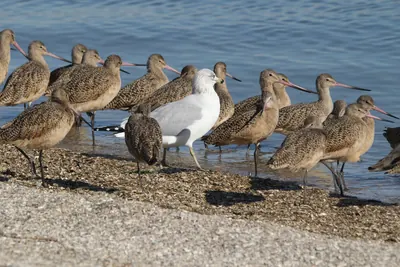 Ring-billed Gull97%
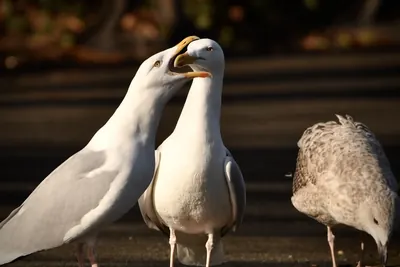 American Herring Gull89%
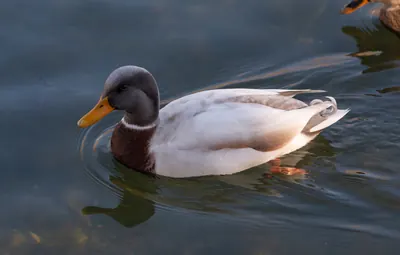 Mallard77%
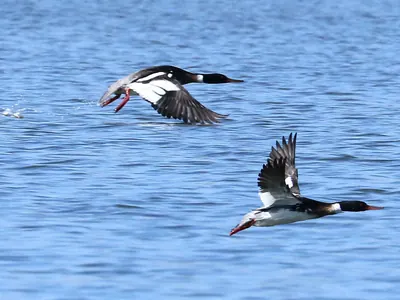 Red-breasted Merganser71%
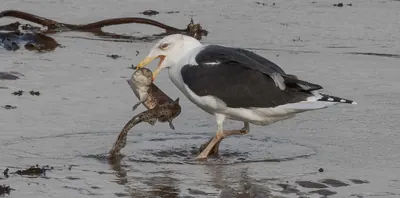 Great Black-backed Gull68%
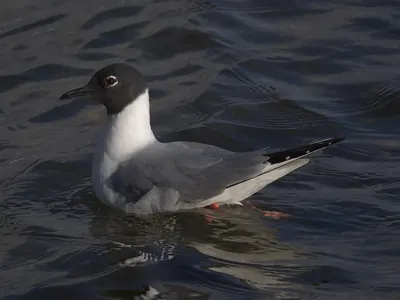 Bonaparte's Gull44%
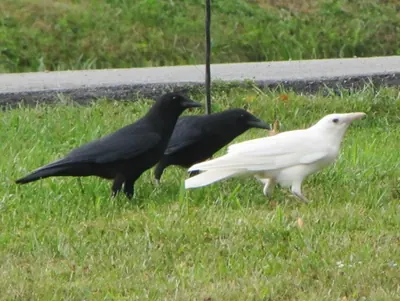 American Crow38%
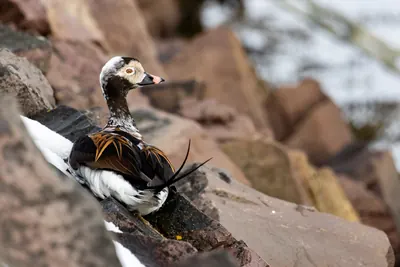 Long-tailed Duck35%
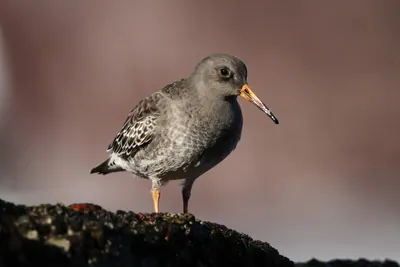 Purple Sandpiper27%
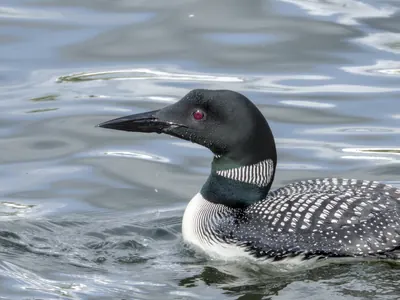 Common Loon20%
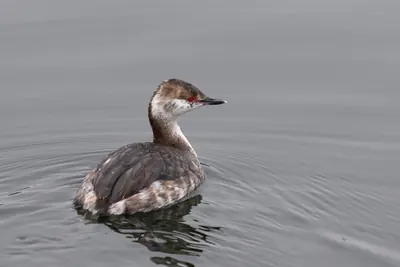 Horned Grebe19%
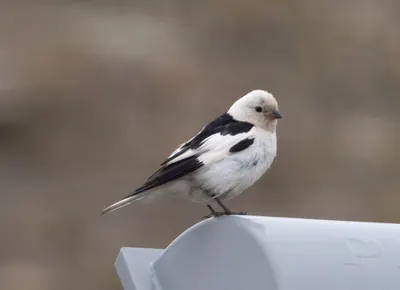 Snow Bunting17%
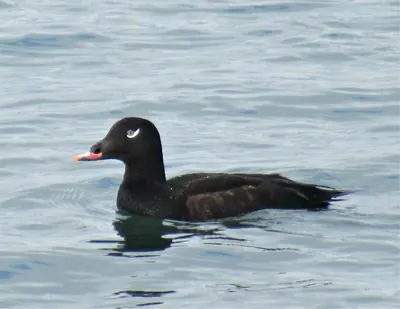 White-winged Scoter16%
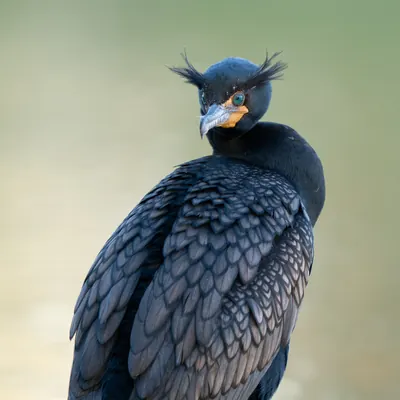 Double-crested Cormorant15%
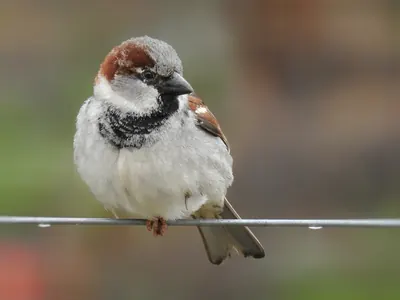 House Sparrow14%