Birding spot · Dutchess County, New York
Birding at Waterfront Park: What You'll See Each Week
In November, the birds most often reported at Waterfront Park are Ring-billed Gull (98%), American Herring Gull (71%), and Canada Goose (57%). It is busiest in spring, when 46 species turn up on at least 1 in 20 checklists, and species counts peak in late February (50 species). 113 species have been reported here across 818 complete checklists from 230 birders.
Species by week
In November: what to expect
- 1
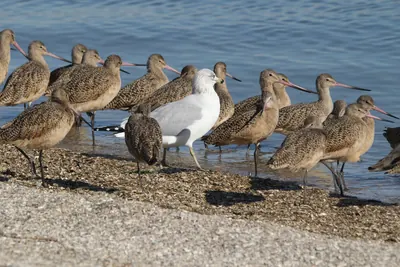 Ring-billed Gull98%
- 2
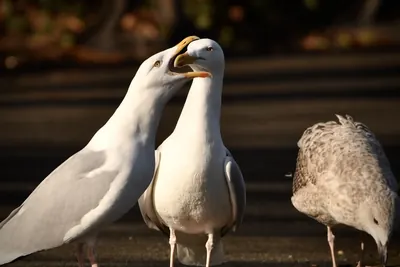 American Herring Gull71%
- 3
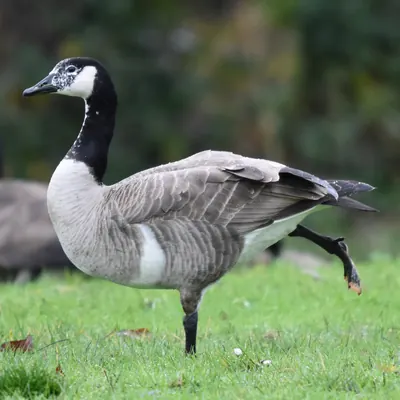 Canada Goose57%
- 4
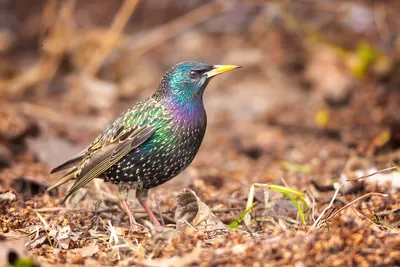 European Starling50%
- 5
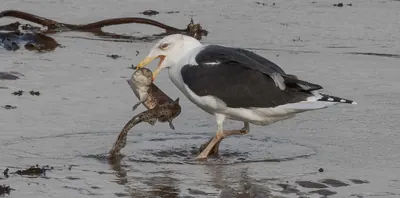 Great Black-backed Gull45%
- 6
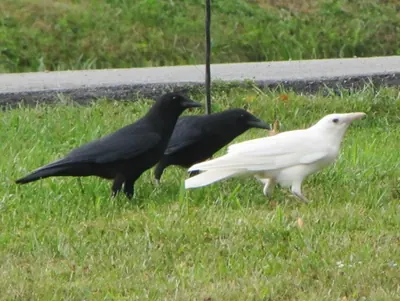 American Crow43%
- 7
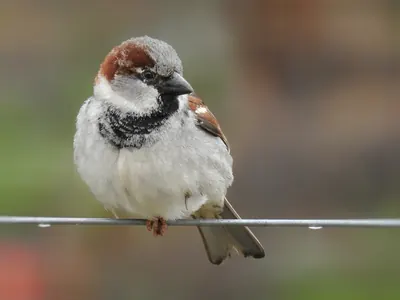 House Sparrow43%
- 8
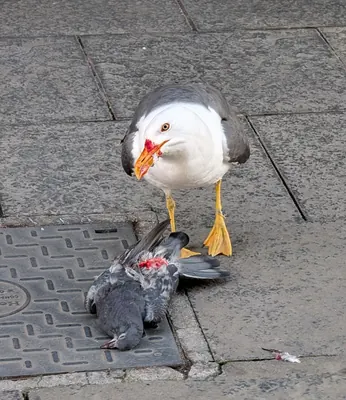 Lesser Black-backed Gull38%
- 9
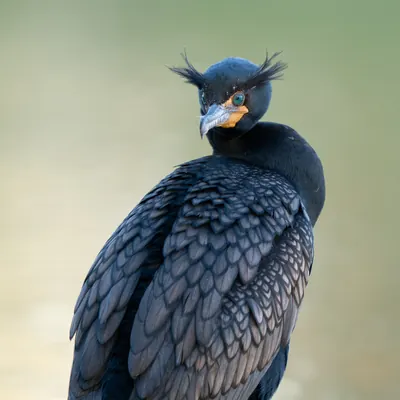 Double-crested Cormorant36%
- 10
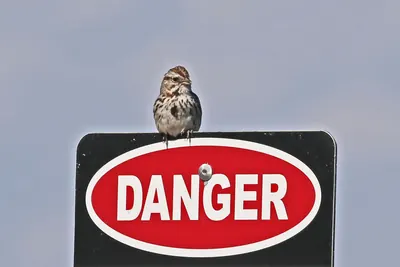 Song Sparrow29%
- 11
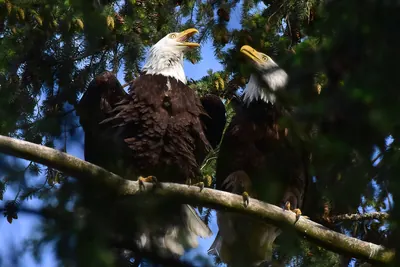 Bald Eagle26%
- 12
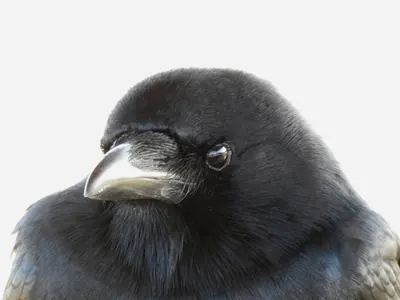 Fish Crow26%
- 13
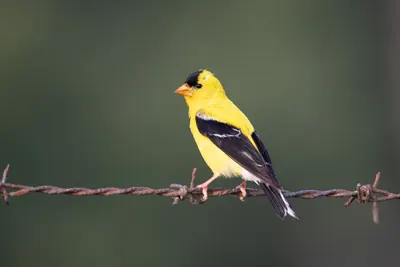 American Goldfinch24%
- 14
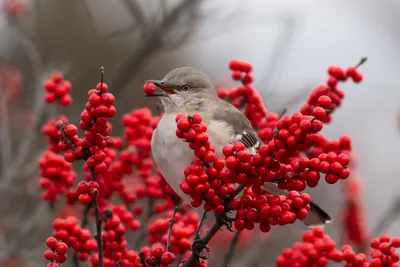 Northern Mockingbird21%
- 15
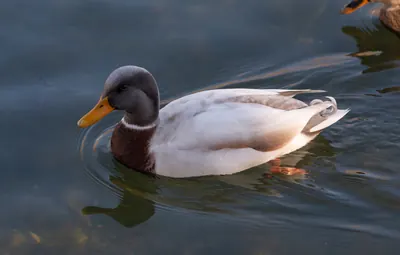 Mallard19%
Share of complete checklists at this spot that reported the bird in November. The sparkline is the whole year, with this month highlighted.
Season by season
Winter 34 species
Spring 46 species
Summer 45 species
Fall 34 species
Specialties
Birds reported far more often here than across New York.
- Glaucous-winged Gull
- Neotropic Cormorant
- Iceland Gull
- Glaucous Gull
- Lesser Black-backed Gull
- Fish Crow
- Great Black-backed Gull
- Black Vulture
Nearby spots
- Varick Homes (1.6 km)
- Denning Point (2.0 km)
- Stonykill Environmental Education Center (4.4 km)
- Doodletown Bight (22.7 km)
- Sylvan Lake (23.3 km)
- Shawangunk Grasslands National Wildlife Refuge (23.3 km)
Frequency is the share of complete checklists at this location that listed the bird, 2016–2025. Busy places report more of everything, and the weekly chart counts species on at least 5% of checklists so a few stray reports do not inflate it. How to read it.