Birding spot · Ottawa County, Ohio
Birding at Magee Marsh Wildlife Area (southeast): What You'll See Each Week
In November, the birds most often reported at Magee Marsh Wildlife Area (southeast) are Red-winged Blackbird (77%), Canada Goose (71%), and Bald Eagle (69%). It is busiest in spring, when 116 species turn up on at least 1 in 20 checklists, and species counts peak in mid May (115 species). 209 species have been reported here across 1,295 complete checklists from 746 birders.
Species by week
In November: what to expect
- 1
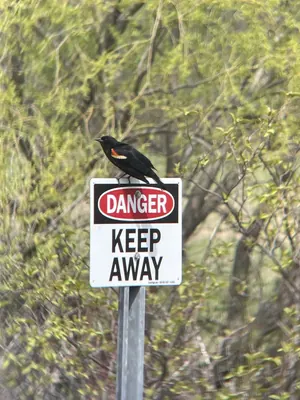 Red-winged Blackbird77%
- 2
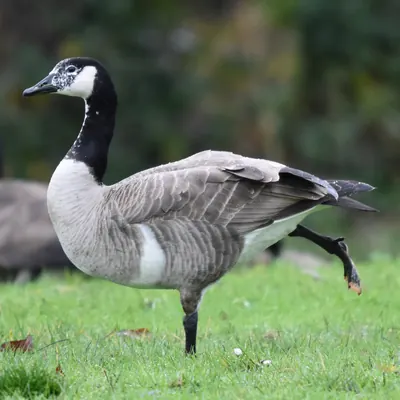 Canada Goose71%
- 3
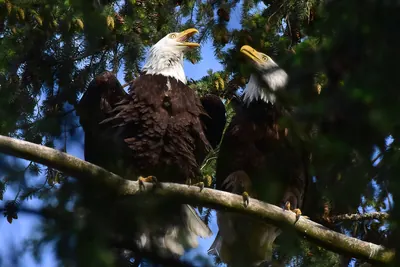 Bald Eagle69%
- 4Northern Yellow Warbler64%
- 5
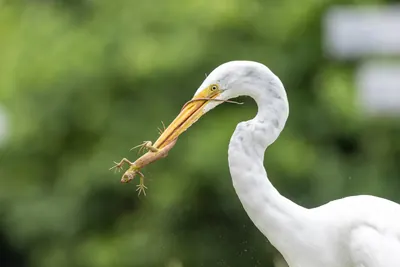 Great Egret64%
- 6
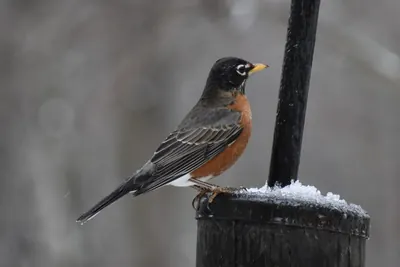 American Robin63%
- 7
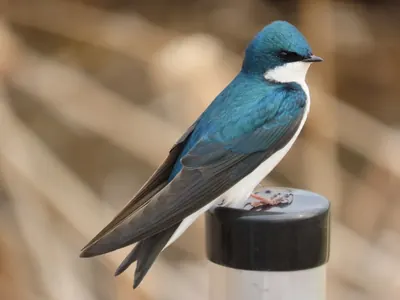 Tree Swallow63%
- 8
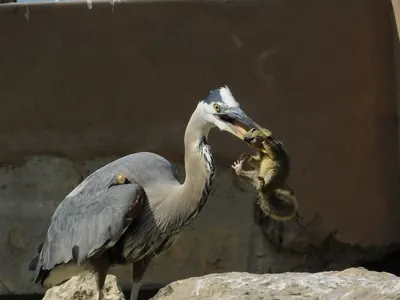 Great Blue Heron60%
- 9
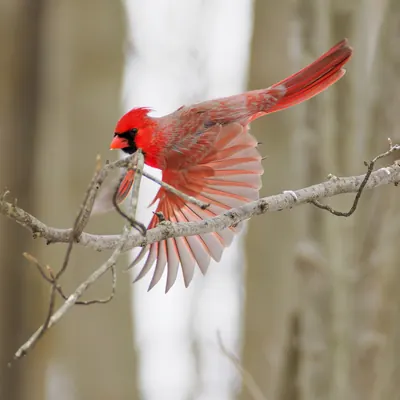 Northern Cardinal60%
- 10
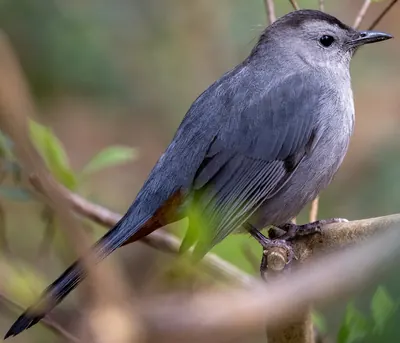 Gray Catbird58%
- 11
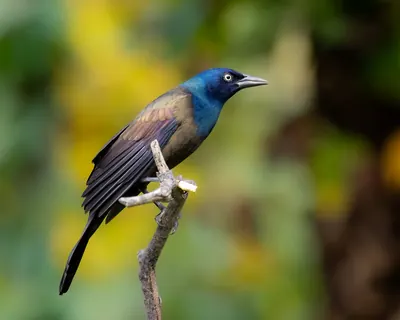 Common Grackle56%
- 12
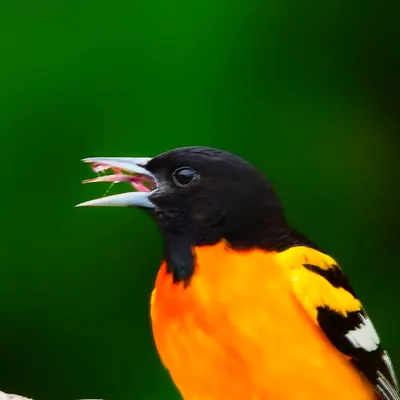 Baltimore Oriole47%
- 13Eastern Warbling Vireo47%
- 14Northern House Wren43%
- 15
 Yellow-rumped Warbler42%
Share of complete checklists at this spot that reported the bird in November. The sparkline is the whole year, with this month highlighted.
Season by season
Winter 36 species
- Bald Eagle71%
- Canada Goose51%
- Northern Cardinal38%
- Trumpeter Swan37%
- Mallard31%
Spring 116 species
Summer 64 species
Fall 77 species
Specialties
Birds reported far more often here than across Ohio.
- Eastern Whip-poor-will
- Snowy Egret
- Black-billed Cuckoo
- Black-throated Blue Warbler
- Eastern Screech-Owl
- Canada Warbler
- Prothonotary Warbler
- American Woodcock
Nearby spots
- Magee Marsh Wildlife Area (southeast) (1.7 km)
- Turtle Creek Bay (1.9 km)
- Magee Marsh Wildlife Area (France Marsh) (2.0 km)
- Magee Marsh Wildlife Area (east) (2.0 km)
- France Marsh (2.3 km)
- Magee Marsh Wildlife Area (east) (2.5 km)
Frequency is the share of complete checklists at this location that listed the bird, 2016–2025. Busy places report more of everything, and the weekly chart counts species on at least 5% of checklists so a few stray reports do not inflate it. How to read it.