Birding spot · Wyandot County, Ohio
Birding at Upper Sandusky Reservoir: What You'll See Each Week In November, the birds most often reported at Upper Sandusky Reservoir are Canada Goose (93%), Ruddy Duck (87%), and Pied-billed Grebe (71%). It is busiest in summer, when 65 species turn up on at least 1 in 20 checklists, and species counts peak in early May (74 species). 142 species have been reported here across 890 complete checklists from 356 birders.
Species by week 0 20 40 60 80 Jan 1-7: 39 species on 5%+ of 30 checklists Jan 8-14: 32 species on 5%+ of 125 checklists Jan 15-21: 26 species on 5%+ of 121 checklists Jan 22-31: 29 species on 5%+ of 84 checklists Feb 1-7: 36 species on 5%+ of 27 checklists Feb 8-14: low data (9 checklists) Feb 15-21: low data (8 checklists) Feb 22-28: 58 species on 5%+ of 20 checklists Mar 1-7: 57 species on 5%+ of 13 checklists Mar 8-14: 51 species on 5%+ of 31 checklists Mar 15-21: 57 species on 5%+ of 32 checklists Mar 22-31: 64 species on 5%+ of 31 checklists Apr 1-7: 73 species on 5%+ of 17 checklists Apr 8-14: 69 species on 5%+ of 16 checklists Apr 15-21: 71 species on 5%+ of 13 checklists Apr 22-30: 69 species on 5%+ of 11 checklists May 1-7: 74 species on 5%+ of 10 checklists May 8-14: low data (3 checklists) May 15-21: low data (1 checklists) May 22-31: low data (5 checklists) Jun 1-7: low data (3 checklists) Jun 8-14: low data (1 checklists) Jun 15-21: low data (3 checklists) Jun 22-30: low data (1 checklists) Jul 1-7: low data (3 checklists) Jul 8-14: low data (3 checklists) Jul 15-21: low data (6 checklists) Jul 22-31: low data (5 checklists) Aug 1-7: low data (5 checklists) Aug 8-14: low data (4 checklists) Aug 15-21: low data (2 checklists) Aug 22-31: low data (3 checklists) Sep 1-7: low data (6 checklists) Sep 8-14: low data (9 checklists) Sep 15-21: low data (2 checklists) Sep 22-30: 59 species on 5%+ of 10 checklists Oct 1-7: low data (5 checklists) Oct 8-14: low data (5 checklists) Oct 15-21: low data (9 checklists) Oct 22-31: 67 species on 5%+ of 20 checklists Nov 1-7: 61 species on 5%+ of 14 checklists Nov 8-14: 67 species on 5%+ of 19 checklists Nov 15-21: 60 species on 5%+ of 15 checklists Nov 22-30: 46 species on 5%+ of 43 checklists Dec 1-7: 43 species on 5%+ of 27 checklists Dec 8-14: 55 species on 5%+ of 19 checklists Dec 15-21: 58 species on 5%+ of 18 checklists Dec 22-31: 34 species on 5%+ of 23 checklists Jan Feb Mar Apr May Jun Jul Aug Sep Oct Nov Dec Number of species reported on at least 5% of complete checklists, by week (4 per month). Grey bars: fewer than 10 checklists, not counted. In November: what to expect 1 Canada Goose 93% 2 Ruddy Duck 87% 3 Pied-billed Grebe 71% 4 Mallard 66% 5 Bald Eagle 63% 6 Ring-billed Gull 60% 7 Redhead 53% 8 Double-crested Cormorant 45% 9 American Crow 41% 10 Blue Jay 35% 11 Horned Grebe 35% 12 European Starling 34% 13 Lesser Scaup 34% 14 Bufflehead 32% 15 Gadwall 31% Share of complete checklists at this spot that reported the bird in November. The sparkline is the whole year, with this month highlighted.
Season by season Specialties Birds reported far more often here than across Ohio.
Northern Wheatear33% of checklists here vs 0.1% statewide: 1621.1× Cackling Goose 6.4% of checklists here vs 0.2% statewide: 33.0× Ruddy Duck 44% of checklists here vs 3.2% statewide: 13.8× Tundra Swan 11% of checklists here vs 1.0% statewide: 10.9× Horned Grebe 16% of checklists here vs 1.9% statewide: 8.3× Common Loon 12% of checklists here vs 1.8% statewide: 6.9× Redhead 15% of checklists here vs 2.4% statewide: 6.1× Northern Harrier 11% of checklists here vs 1.9% statewide: 6.0× Nearby spots Frequency is the share of complete checklists at this location that listed the bird, 2016–2025. Busy places report more of everything, and the weekly chart counts species on at least 5% of checklists so a few stray reports do not inflate it. How to read it .
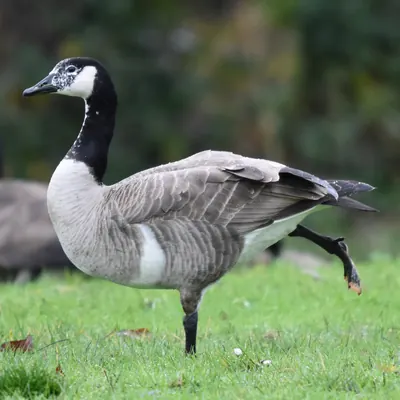 Canada Goose93%
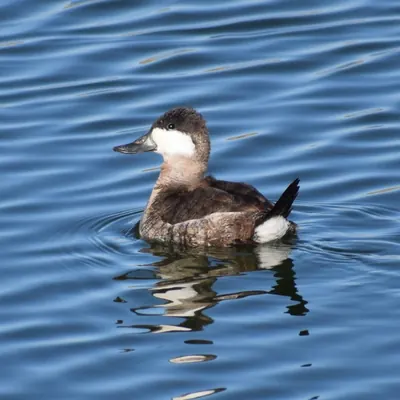 Ruddy Duck87%
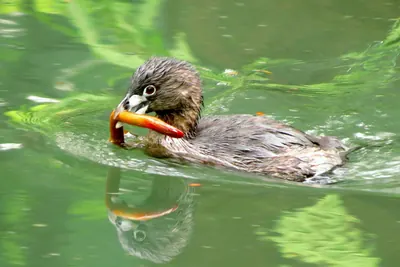 Pied-billed Grebe71%
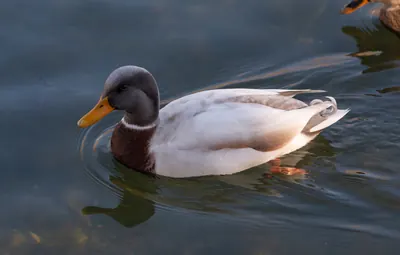 Mallard66%
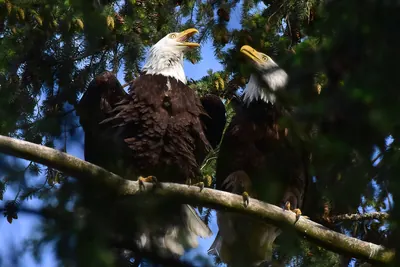 Bald Eagle63%
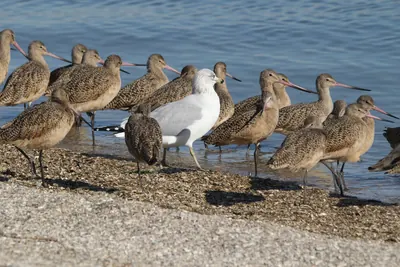 Ring-billed Gull60%
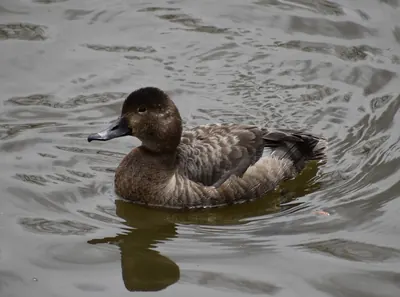 Redhead53%
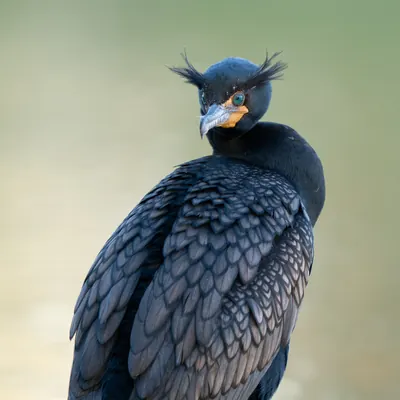 Double-crested Cormorant45%
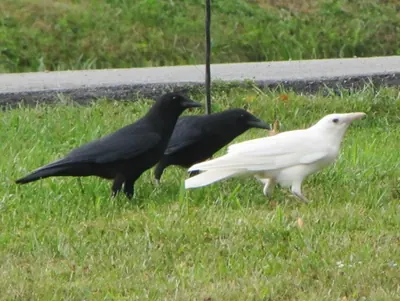 American Crow41%
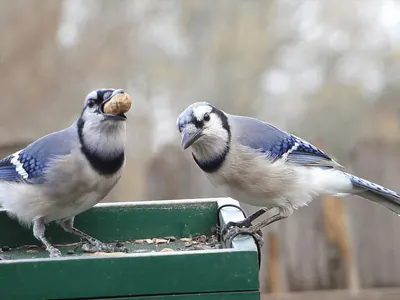 Blue Jay35%
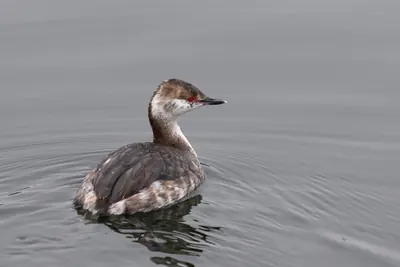 Horned Grebe35%
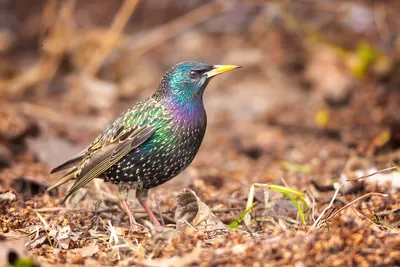 European Starling34%
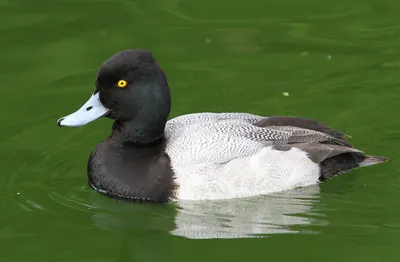 Lesser Scaup34%
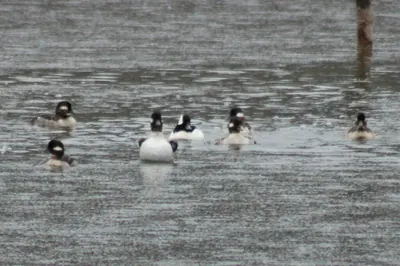 Bufflehead32%
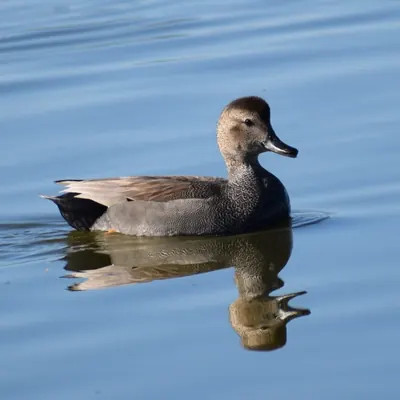 Gadwall31%