Birding spot · Burnet County, Texas
Birding at Balcones Canyonlands National Wildlife Refuge: What You'll See Each Week
In November, the birds most often reported at Balcones Canyonlands National Wildlife Refuge are Northern Cardinal (80%), Spotted Towhee (73%), and Eastern Phoebe (57%). It is busiest in spring, when 60 species turn up on at least 1 in 20 checklists, and species counts peak in the second week of May (66 species). 172 species have been reported here across 1,532 complete checklists from 907 birders.
Species by week
In November: what to expect
- 1
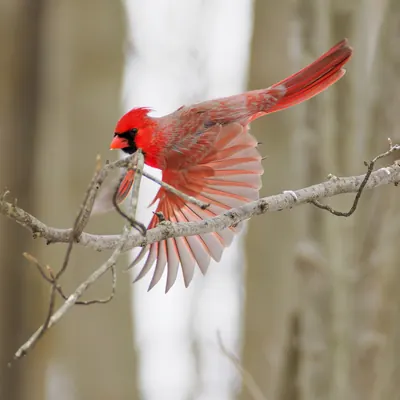 Northern Cardinal80%
- 2
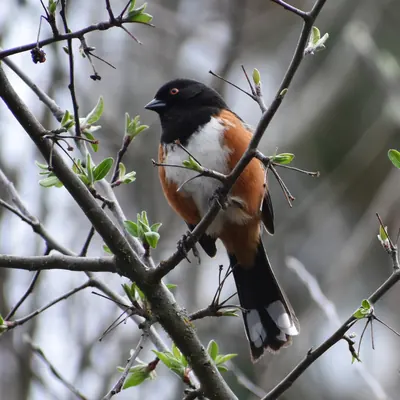 Spotted Towhee73%
- 3
 Eastern Phoebe57%
- 4
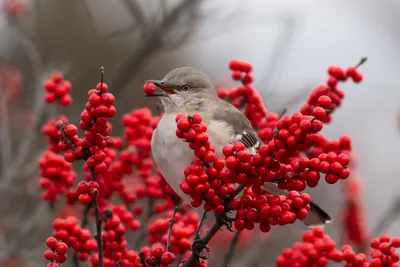 Northern Mockingbird57%
- 5
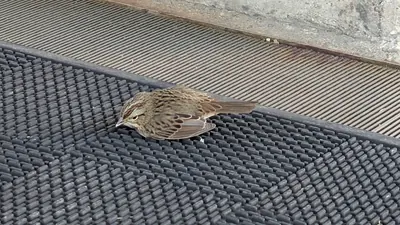 Lincoln's Sparrow55%
- 6
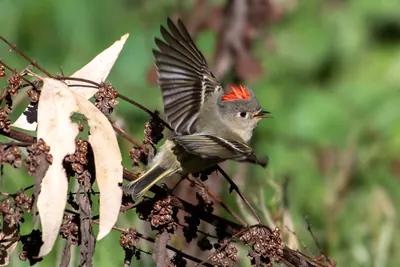 Ruby-crowned Kinglet53%
- 7
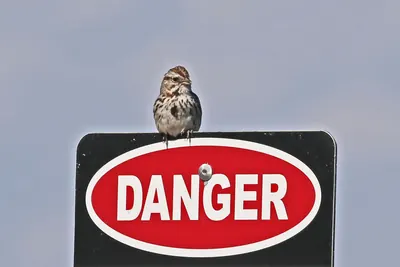 Song Sparrow53%
- 8
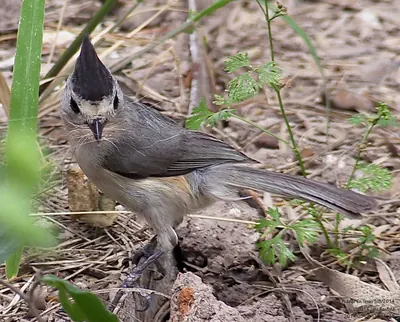 Black-crested Titmouse52%
- 9
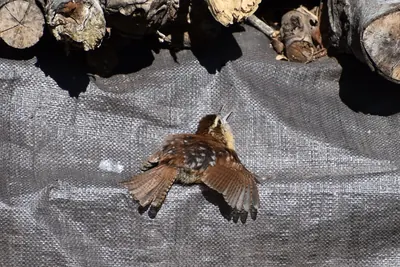 Carolina Wren52%
- 10
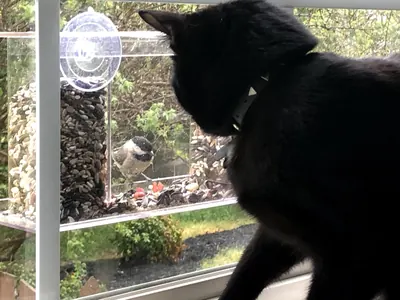 Carolina Chickadee48%
- 11
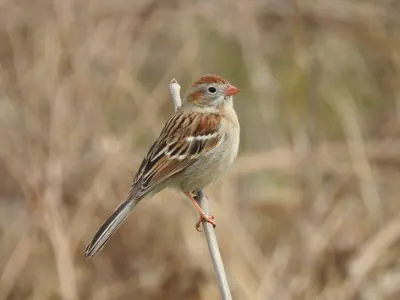 Field Sparrow48%
- 12
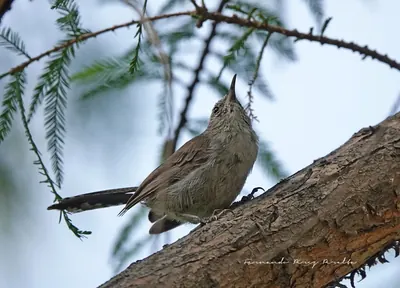 Bewick's Wren43%
- 13
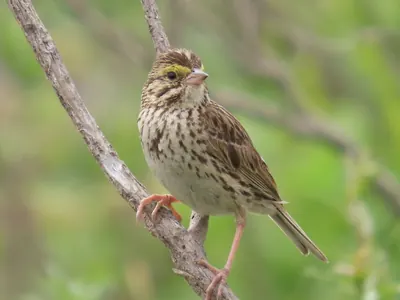 Savannah Sparrow43%
- 14
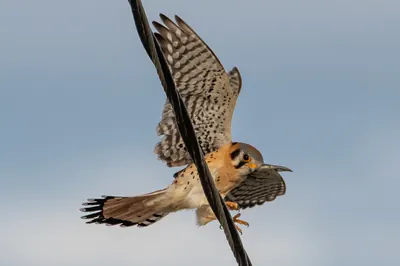 American Kestrel42%
- 15
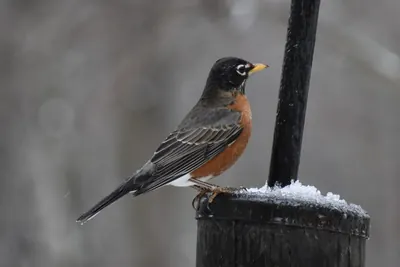 American Robin42%
Share of complete checklists at this spot that reported the bird in November. The sparkline is the whole year, with this month highlighted.
Season by season
Winter 52 species
Spring 60 species
Summer 42 species
Fall 46 species
Specialties
Birds reported far more often here than across Texas.
- Black-capped Vireo
- Golden-cheeked Warbler
- Rufous-crowned Sparrow
- Spotted Towhee
- Blue Grosbeak
- Woodhouse's Scrub-Jay
- Northern Bobwhite
- Grasshopper Sparrow
Nearby spots
- Balcones Canyonlands National Wildlife Refuge (northeast) (5.1 km)
- Devine Lake Park (18.7 km)
- Georgetown Recreation Area (25.0 km)
- Bob Wentz/ Windy Point (28.1 km)
- Milton Reimers Ranch Park (28.6 km)
Frequency is the share of complete checklists at this location that listed the bird, 2016–2025. Busy places report more of everything, and the weekly chart counts species on at least 5% of checklists so a few stray reports do not inflate it. How to read it.