Birding spot · McMullen County, Texas
Birding at Choke Canyon State Park: What You'll See Each Week In November, the birds most often reported at Choke Canyon State Park are Green Jay (79%), Great-tailed Grackle (77%), and Great Egret (73%). It is busiest in spring, when 110 species turn up on at least 1 in 20 checklists, and species counts peak in early September (125 species). 263 species have been reported here across 2,356 complete checklists from 1,135 birders.
Species by week 0 50 100 150 Jan 1-7: 102 species on 5%+ of 143 checklists Jan 8-14: 106 species on 5%+ of 130 checklists Jan 15-21: 110 species on 5%+ of 156 checklists Jan 22-31: 103 species on 5%+ of 165 checklists Feb 1-7: 93 species on 5%+ of 64 checklists Feb 8-14: 98 species on 5%+ of 68 checklists Feb 15-21: 98 species on 5%+ of 56 checklists Feb 22-28: 102 species on 5%+ of 44 checklists Mar 1-7: 100 species on 5%+ of 53 checklists Mar 8-14: 82 species on 5%+ of 42 checklists Mar 15-21: 98 species on 5%+ of 50 checklists Mar 22-31: 106 species on 5%+ of 54 checklists Apr 1-7: 92 species on 5%+ of 24 checklists Apr 8-14: 97 species on 5%+ of 51 checklists Apr 15-21: 102 species on 5%+ of 63 checklists Apr 22-30: 124 species on 5%+ of 99 checklists May 1-7: 112 species on 5%+ of 30 checklists May 8-14: 102 species on 5%+ of 22 checklists May 15-21: 116 species on 5%+ of 18 checklists May 22-31: 94 species on 5%+ of 16 checklists Jun 1-7: 80 species on 5%+ of 10 checklists Jun 8-14: 82 species on 5%+ of 14 checklists Jun 15-21: 92 species on 5%+ of 13 checklists Jun 22-30: 75 species on 5%+ of 13 checklists Jul 1-7: 76 species on 5%+ of 25 checklists Jul 8-14: low data (8 checklists) Jul 15-21: low data (8 checklists) Jul 22-31: 89 species on 5%+ of 22 checklists Aug 1-7: low data (9 checklists) Aug 8-14: 71 species on 5%+ of 15 checklists Aug 15-21: 104 species on 5%+ of 10 checklists Aug 22-31: low data (7 checklists) Sep 1-7: 125 species on 5%+ of 13 checklists Sep 8-14: 87 species on 5%+ of 12 checklists Sep 15-21: 114 species on 5%+ of 16 checklists Sep 22-30: 87 species on 5%+ of 25 checklists Oct 1-7: 81 species on 5%+ of 28 checklists Oct 8-14: 96 species on 5%+ of 32 checklists Oct 15-21: 116 species on 5%+ of 17 checklists Oct 22-31: 116 species on 5%+ of 35 checklists Nov 1-7: 102 species on 5%+ of 51 checklists Nov 8-14: 121 species on 5%+ of 39 checklists Nov 15-21: 105 species on 5%+ of 45 checklists Nov 22-30: 92 species on 5%+ of 63 checklists Dec 1-7: 111 species on 5%+ of 22 checklists Dec 8-14: 118 species on 5%+ of 39 checklists Dec 15-21: 106 species on 5%+ of 132 checklists Dec 22-31: 102 species on 5%+ of 285 checklists Jan Feb Mar Apr May Jun Jul Aug Sep Oct Nov Dec Number of species reported on at least 5% of complete checklists, by week (4 per month). Grey bars: fewer than 10 checklists, not counted. In November: what to expect 1 Green Jay 79% 2 Great-tailed Grackle 77% 3 Great Egret 73% 4 Golden-fronted Woodpecker 72% 5 Turkey Vulture 68% 6 American Coot 64% 7 Great Blue Heron 62% 8 Crested Caracara 59% 9 Northern Cardinal 58% 10 Osprey 54% 11 Northern Mockingbird 54% 12 Pied-billed Grebe 49% 13 Black Vulture 48% 14 Red-winged Blackbird 48% 15 Ladder-backed Woodpecker 47% Share of complete checklists at this spot that reported the bird in November. The sparkline is the whole year, with this month highlighted.
Season by season Specialties Birds reported far more often here than across Texas.
Spotted Rail16% of checklists here vs 0.1% statewide: 896.2× Audubon's Oriole 13% of checklists here vs 0.5% statewide: 25.4× Canvasback 20% of checklists here vs 0.9% statewide: 22.4× Cinnamon Teal 20% of checklists here vs 0.9% statewide: 21.3× Wild Turkey 25% of checklists here vs 1.3% statewide: 19.3× Fulvous Whistling-Duck 13% of checklists here vs 0.8% statewide: 16.8× Vermilion Flycatcher 45% of checklists here vs 2.8% statewide: 16.0× Sora 23% of checklists here vs 1.6% statewide: 14.4× Frequency is the share of complete checklists at this location that listed the bird, 2016–2025. Busy places report more of everything, and the weekly chart counts species on at least 5% of checklists so a few stray reports do not inflate it. How to read it .
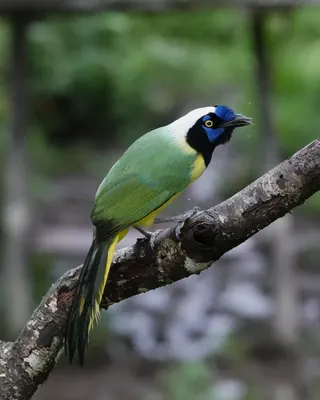 Green Jay79%
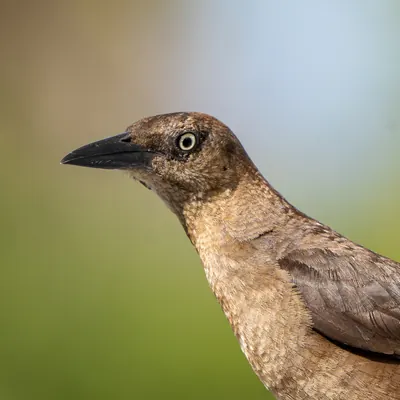 Great-tailed Grackle77%
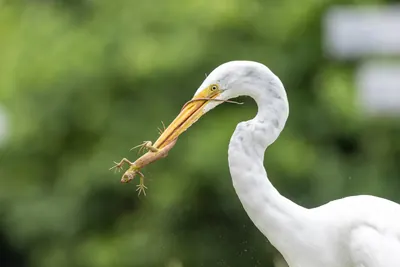 Great Egret73%
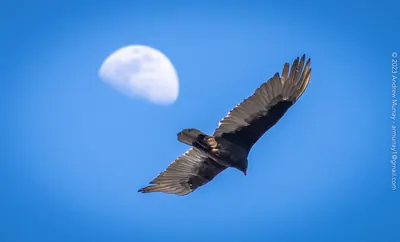 Turkey Vulture68%
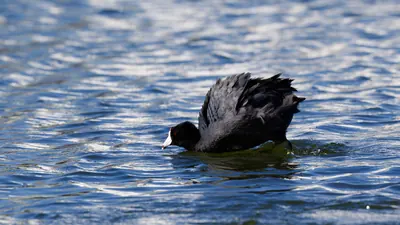 American Coot64%
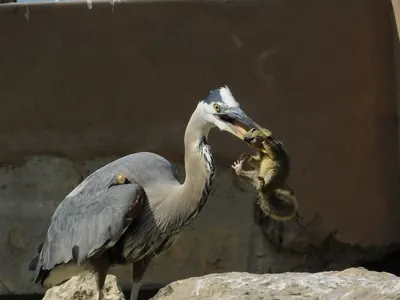 Great Blue Heron62%
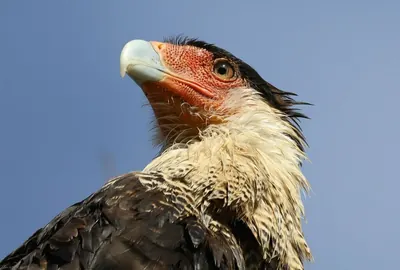 Crested Caracara59%
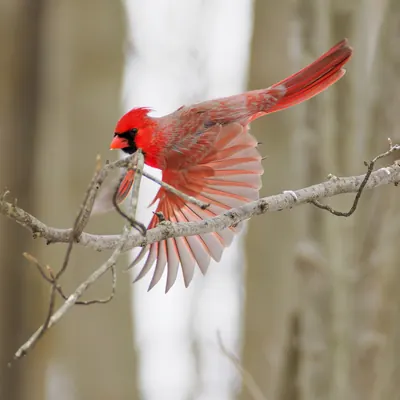 Northern Cardinal58%
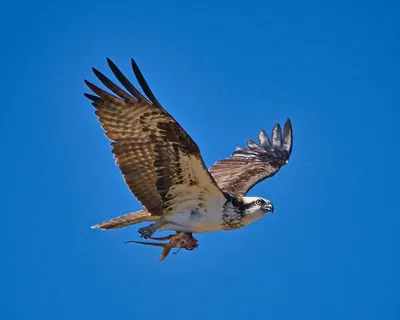 Osprey54%
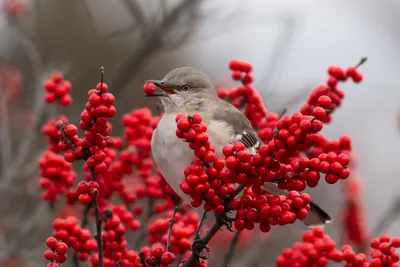 Northern Mockingbird54%
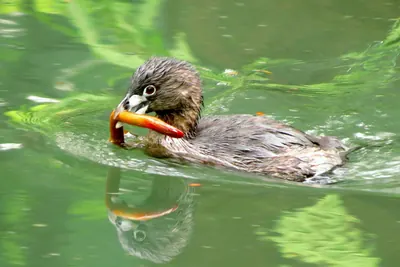 Pied-billed Grebe49%
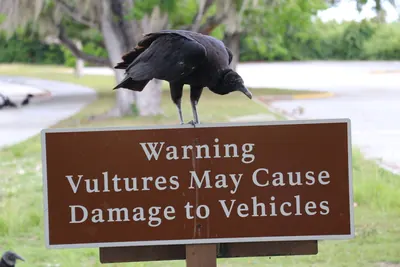 Black Vulture48%
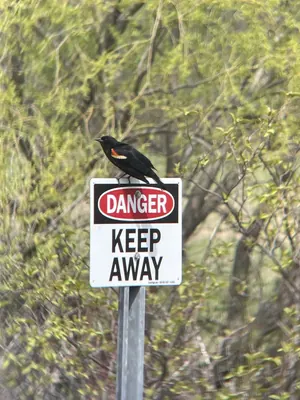 Red-winged Blackbird48%
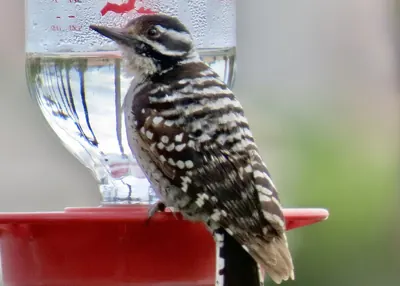 Ladder-backed Woodpecker47%