Birding spot · Aransas County, Texas
Birding at Rockport Beach Park: What You'll See Each Week
In November, the birds most often reported at Rockport Beach Park are Laughing Gull (93%), Brown Pelican (88%), and Great Blue Heron (83%). It is busiest in spring, when 51 species turn up on at least 1 in 20 checklists, and species counts peak in the second week of May (62 species). 123 species have been reported here across 1,056 complete checklists from 583 birders.
Species by week
In November: what to expect
- 1
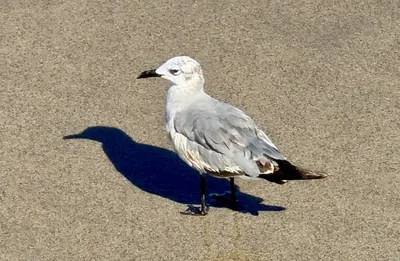 Laughing Gull93%
- 2
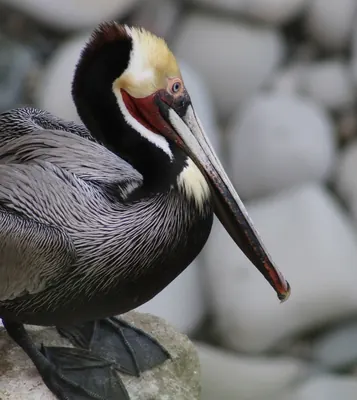 Brown Pelican88%
- 3
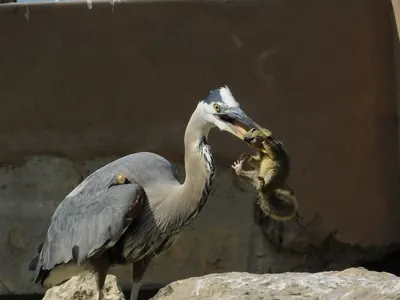 Great Blue Heron83%
- 4
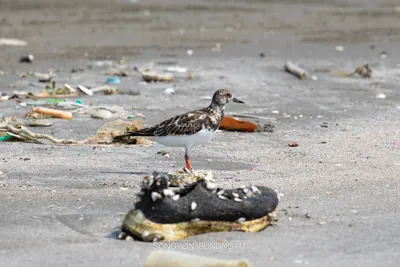 Ruddy Turnstone78%
- 5
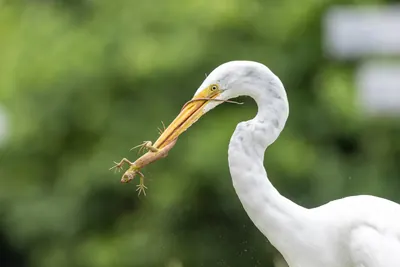 Great Egret63%
- 6
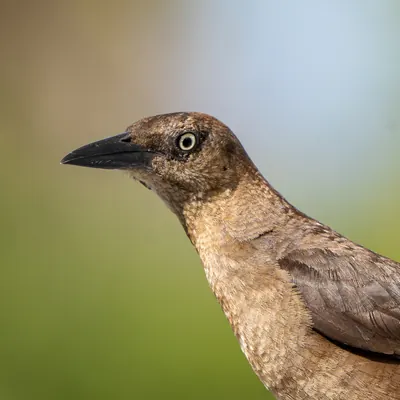 Great-tailed Grackle61%
- 7
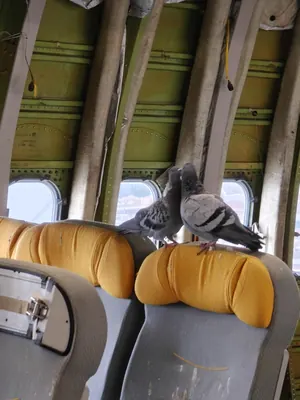 Rock Pigeon61%
- 8
 Killdeer51%
- 9
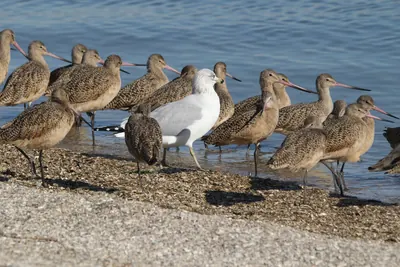 Ring-billed Gull49%
- 10
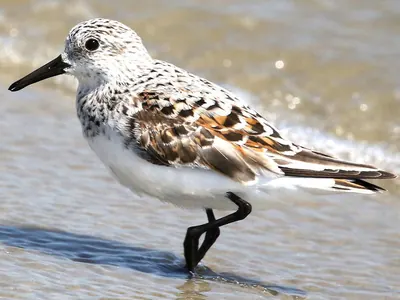 Sanderling46%
- 11
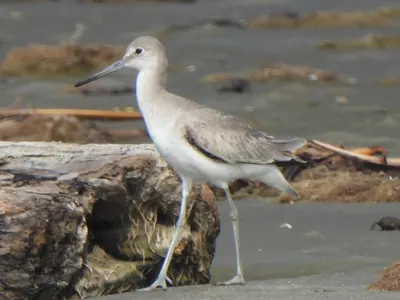 Willet44%
- 12
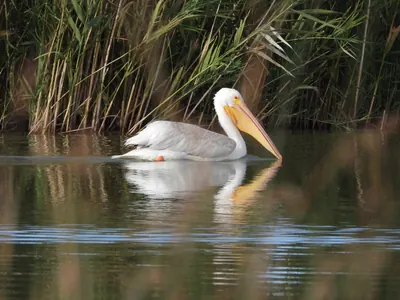 American White Pelican34%
- 13
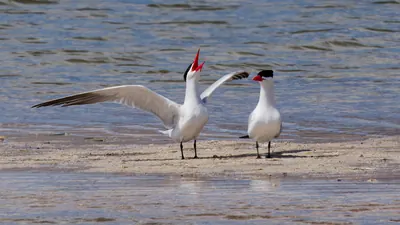 Caspian Tern34%
- 14
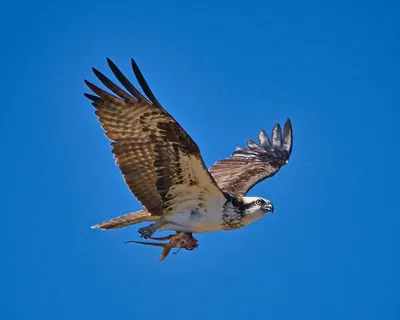 Osprey34%
- 15
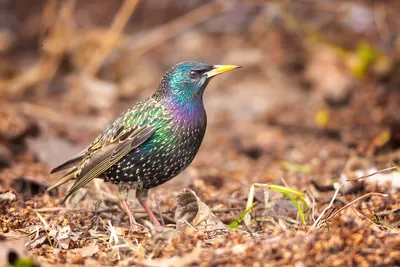 European Starling32%
Share of complete checklists at this spot that reported the bird in November. The sparkline is the whole year, with this month highlighted.
Season by season
Winter 44 species
Spring 51 species
Summer 42 species
Fall 51 species
Specialties
Birds reported far more often here than across Texas.
- Sooty Tern
- Black Skimmer
- Ruddy Turnstone
- Sandwich Tern
- Reddish Egret
- Royal Tern
- Common Loon
- Long-billed Curlew
Nearby spots
- Wetlands Park (2.0 km)
- Goose Island State Park (12.3 km)
- Goose Island State Park (Hail Point) (12.7 km)
- I.B. Magee Jr Beach Park and Horace Caldwell Pier (21.7 km)
- Whitney Lake Park (22.2 km)
- Port Aransas Nature Preserve at Charlie's Pasture (Salt Island) (22.5 km)
Frequency is the share of complete checklists at this location that listed the bird, 2016–2025. Busy places report more of everything, and the weekly chart counts species on at least 5% of checklists so a few stray reports do not inflate it. How to read it.