Birding spot · Salt Lake County, Utah
Birding at Silver Sands Beach: What You'll See Each Week
In November, the birds most often reported at Silver Sands Beach are California Gull (73%), Mallard (52%), and Canada Goose (50%). It is busiest in summer, when 47 species turn up on at least 1 in 20 checklists, and species counts peak in late August (65 species). 130 species have been reported here across 894 complete checklists from 445 birders.
Species by week
In November: what to expect
- 1
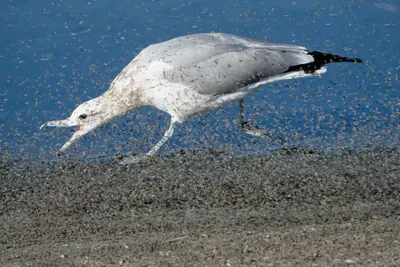 California Gull73%
- 2
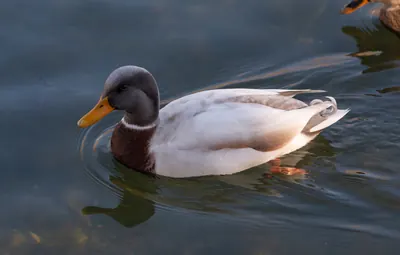 Mallard52%
- 3
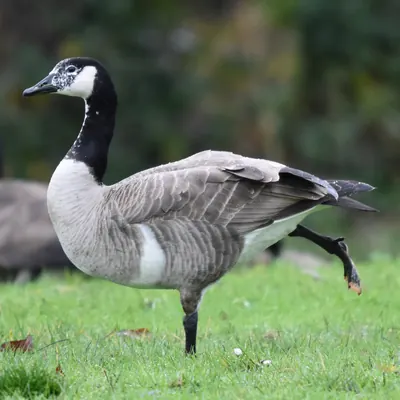 Canada Goose50%
- 4
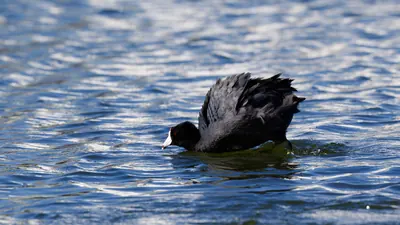 American Coot44%
- 5
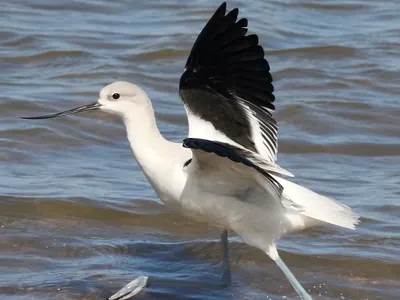 American Avocet41%
- 6
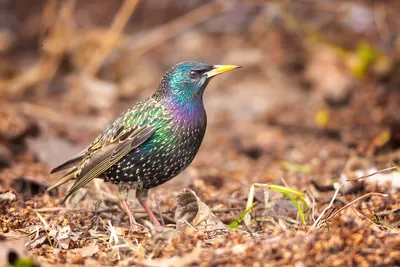 European Starling39%
- 7
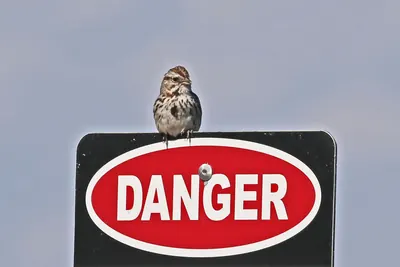 Song Sparrow37%
- 8
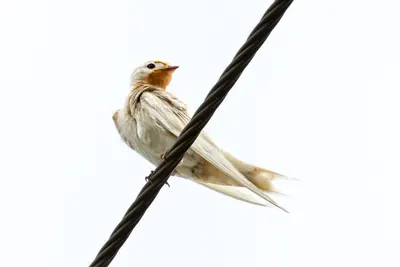 Barn Swallow36%
- 9
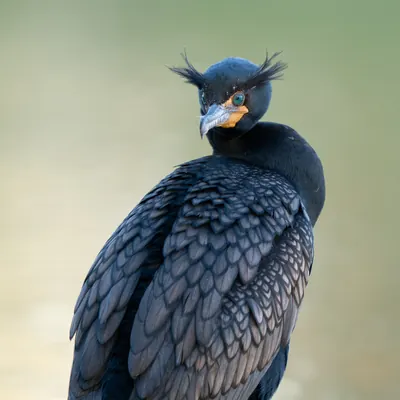 Double-crested Cormorant33%
- 10
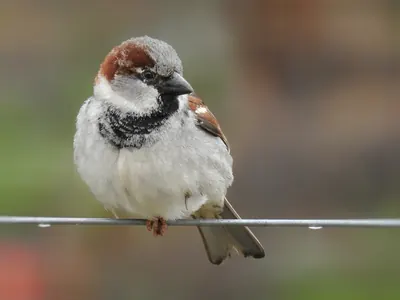 House Sparrow31%
- 11
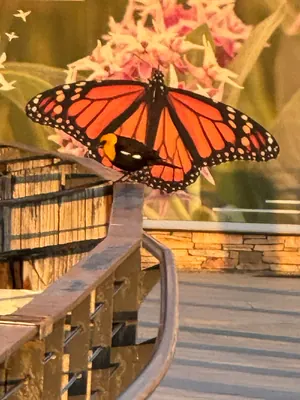 Yellow-headed Blackbird31%
- 12
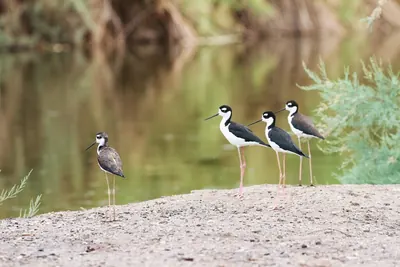 Black-necked Stilt29%
- 13
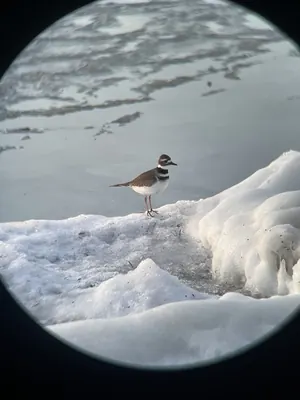 Killdeer28%
- 14
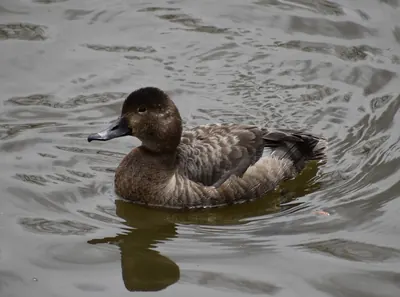 Redhead26%
- 15
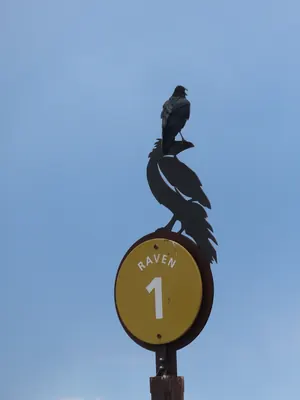 Common Raven26%
Share of complete checklists at this spot that reported the bird in November. The sparkline is the whole year, with this month highlighted.
Season by season
Winter 34 species
Spring 44 species
- Canada Goose74%
- Mallard70%
- American Coot68%
- Redhead63%
- California Gull62%
Summer 47 species
Fall 40 species
Specialties
Birds reported far more often here than across Utah.
- Snowy Plover
- Least Sandpiper
- American Herring Gull
- Black-necked Stilt
- Redhead
- American Avocet
- California Gull
- Franklin's Gull
Nearby spots
- Lee Kay State Wildlife Center (13.9 km)
- Antelope Island State Park (21.4 km)
- Decker Lake Park (22.0 km)
- Mill Creek (24.2 km)
- Western Pacific Addition (24.3 km)
- James Madison Park (24.3 km)
Frequency is the share of complete checklists at this location that listed the bird, 2016–2025. Busy places report more of everything, and the weekly chart counts species on at least 5% of checklists so a few stray reports do not inflate it. How to read it.