Birding spot · Dane County, Wisconsin
Birding at Dane County Waterfowl Production Area: What You'll See Each Week
In November, the birds most often reported at Dane County Waterfowl Production Area are Red-winged Blackbird (88%), Canada Goose (80%), and Mallard (76%). It is busiest in spring, when 57 species turn up on at least 1 in 20 checklists, and species counts peak in the second week of September (76 species). 160 species have been reported here across 1,846 complete checklists from 442 birders.
Species by week
In November: what to expect
- 1
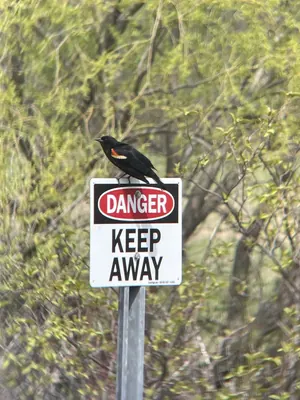 Red-winged Blackbird88%
- 2
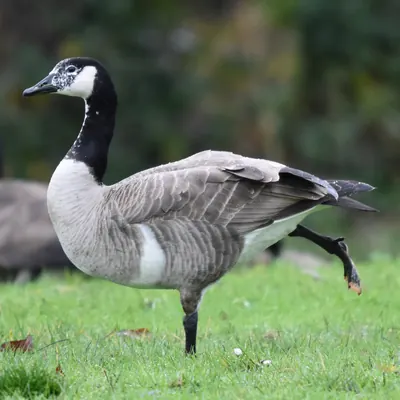 Canada Goose80%
- 3
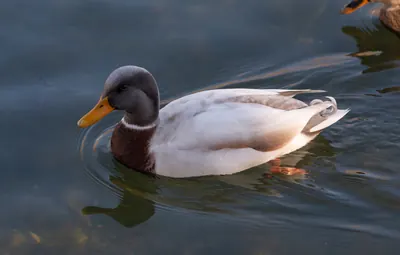 Mallard76%
- 4
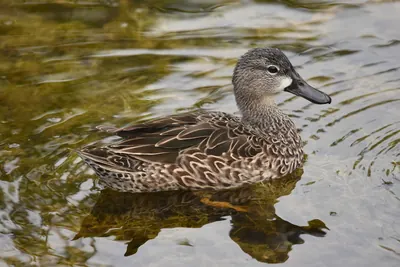 Blue-winged Teal61%
- 5
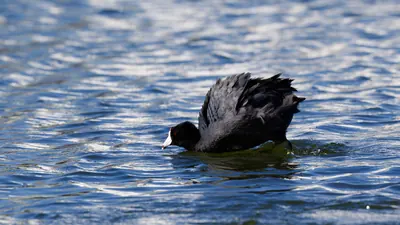 American Coot60%
- 6
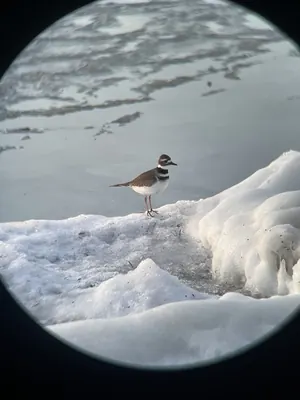 Killdeer56%
- 7
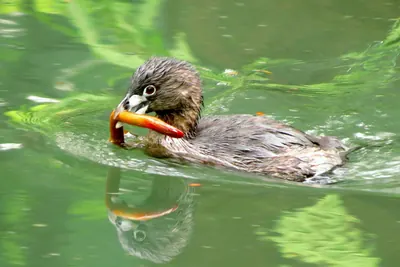 Pied-billed Grebe54%
- 8
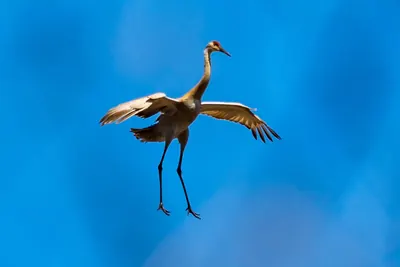 Sandhill Crane54%
- 9
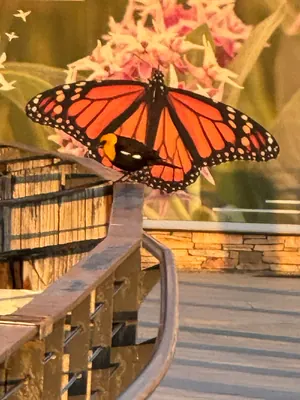 Yellow-headed Blackbird53%
- 10
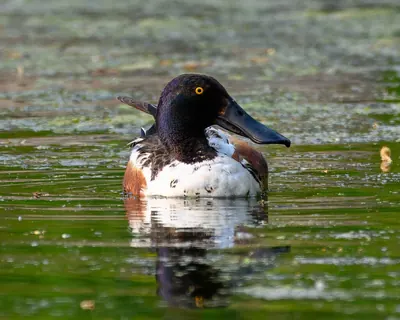 Northern Shoveler42%
- 11
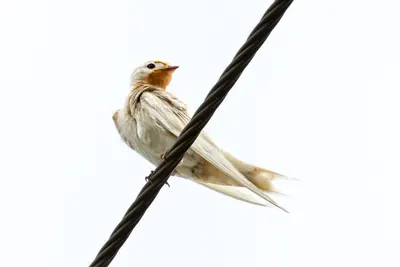 Barn Swallow41%
- 12
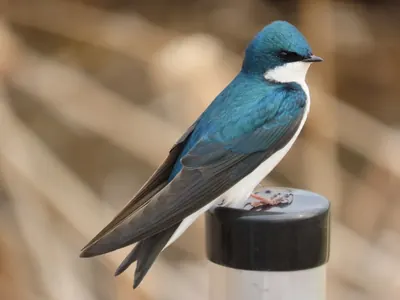 Tree Swallow39%
- 13
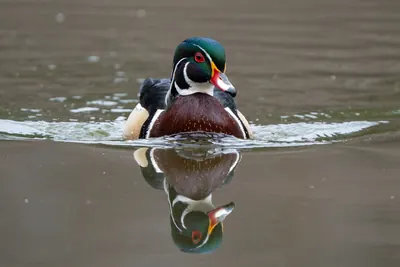 Wood Duck38%
- 14
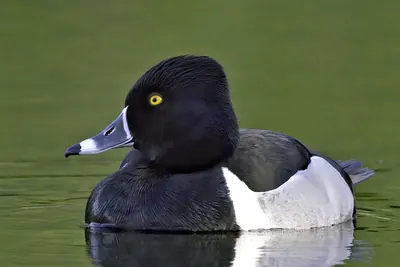 Ring-necked Duck37%
- 15
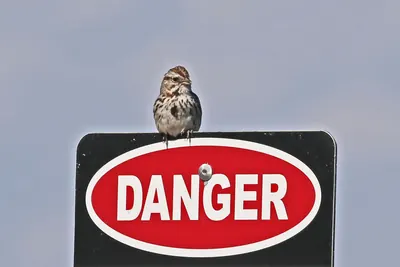 Song Sparrow35%
Share of complete checklists at this spot that reported the bird in November. The sparkline is the whole year, with this month highlighted.
Season by season
Winter 25 species
Spring 57 species
Summer 53 species
- Red-winged Blackbird94%
- Wood Duck81%
- Mallard76%
- Barn Swallow71%
- Killdeer66%
Fall 53 species
Specialties
Birds reported far more often here than across Wisconsin.
- Yellow-headed Blackbird
- Common Gallinule
- American Coot
- Marsh Wren
- Bonaparte's Gull
- Pied-billed Grebe
- Northern Shoveler
- Virginia Rail
Nearby spots
- Goose Lake (9.3 km)
- Cherokee Park (10.4 km)
- Cherokee Lake (11.3 km)
- Governor Nelson State Park (12.4 km)
- Governors Island (13.9 km)
- Pheasant Branch Conservancy Natural Resource Area (14.2 km)
Frequency is the share of complete checklists at this location that listed the bird, 2016–2025. Busy places report more of everything, and the weekly chart counts species on at least 5% of checklists so a few stray reports do not inflate it. How to read it.