Birding spot · Winnebago County, Wisconsin
Birding at Heckrodt Wetland Preserve: What You'll See Each Week In November, the birds most often reported at Heckrodt Wetland Preserve are Black-capped Chickadee (96%), White-breasted Nuthatch (93%), and Downy Woodpecker (90%). It is busiest in spring, when 68 species turn up on at least 1 in 20 checklists, and species counts peak in mid May (89 species). 160 species have been reported here across 2,603 complete checklists from 308 birders.
Species by week 0 20 40 60 80 100 Jan 1-7: 27 species on 5%+ of 75 checklists Jan 8-14: 25 species on 5%+ of 55 checklists Jan 15-21: 27 species on 5%+ of 50 checklists Jan 22-31: 25 species on 5%+ of 64 checklists Feb 1-7: 28 species on 5%+ of 49 checklists Feb 8-14: 30 species on 5%+ of 57 checklists Feb 15-21: 27 species on 5%+ of 56 checklists Feb 22-28: 30 species on 5%+ of 53 checklists Mar 1-7: 33 species on 5%+ of 49 checklists Mar 8-14: 36 species on 5%+ of 47 checklists Mar 15-21: 39 species on 5%+ of 51 checklists Mar 22-31: 41 species on 5%+ of 66 checklists Apr 1-7: 48 species on 5%+ of 70 checklists Apr 8-14: 57 species on 5%+ of 79 checklists Apr 15-21: 55 species on 5%+ of 69 checklists Apr 22-30: 57 species on 5%+ of 92 checklists May 1-7: 70 species on 5%+ of 79 checklists May 8-14: 82 species on 5%+ of 81 checklists May 15-21: 89 species on 5%+ of 86 checklists May 22-31: 64 species on 5%+ of 110 checklists Jun 1-7: 56 species on 5%+ of 44 checklists Jun 8-14: 56 species on 5%+ of 44 checklists Jun 15-21: 62 species on 5%+ of 32 checklists Jun 22-30: 60 species on 5%+ of 36 checklists Jul 1-7: 56 species on 5%+ of 35 checklists Jul 8-14: 48 species on 5%+ of 24 checklists Jul 15-21: 53 species on 5%+ of 22 checklists Jul 22-31: 51 species on 5%+ of 45 checklists Aug 1-7: 50 species on 5%+ of 27 checklists Aug 8-14: 59 species on 5%+ of 36 checklists Aug 15-21: 58 species on 5%+ of 40 checklists Aug 22-31: 62 species on 5%+ of 63 checklists Sep 1-7: 68 species on 5%+ of 55 checklists Sep 8-14: 65 species on 5%+ of 62 checklists Sep 15-21: 64 species on 5%+ of 50 checklists Sep 22-30: 63 species on 5%+ of 53 checklists Oct 1-7: 61 species on 5%+ of 40 checklists Oct 8-14: 43 species on 5%+ of 45 checklists Oct 15-21: 42 species on 5%+ of 41 checklists Oct 22-31: 41 species on 5%+ of 57 checklists Nov 1-7: 40 species on 5%+ of 52 checklists Nov 8-14: 32 species on 5%+ of 43 checklists Nov 15-21: 31 species on 5%+ of 46 checklists Nov 22-30: 32 species on 5%+ of 67 checklists Dec 1-7: 24 species on 5%+ of 45 checklists Dec 8-14: 29 species on 5%+ of 35 checklists Dec 15-21: 30 species on 5%+ of 56 checklists Dec 22-31: 26 species on 5%+ of 70 checklists Jan Feb Mar Apr May Jun Jul Aug Sep Oct Nov Dec Number of species reported on at least 5% of complete checklists, by week (4 per month). Grey bars: fewer than 10 checklists, not counted. In November: what to expect 1 Black-capped Chickadee 96% 2 White-breasted Nuthatch 93% 3 Downy Woodpecker 90% 4 Dark-eyed Junco 88% 5 American Goldfinch 83% 6 Red-bellied Woodpecker 79% 7 House Finch 74% 8 Northern Cardinal 70% 9 Hairy Woodpecker 59% 10 House Sparrow 53% 11 Mallard 52% 12 Mourning Dove 47% 13 American Crow 35% 14 Canada Goose 33% 15 Brown Creeper 27% Share of complete checklists at this spot that reported the bird in November. The sparkline is the whole year, with this month highlighted.
Season by season Specialties Birds reported far more often here than across Wisconsin.
Great Horned Owl 11% of checklists here vs 1.5% statewide: 7.2× Barred Owl 15% of checklists here vs 2.1% statewide: 7.0× Brown Creeper 20% of checklists here vs 3.6% statewide: 5.6× Osprey 10% of checklists here vs 2.7% statewide: 3.8× Tufted Titmouse 28% of checklists here vs 7.4% statewide: 3.8× Winter Wren 5.3% of checklists here vs 1.5% statewide: 3.5× Great Egret 12% of checklists here vs 3.8% statewide: 3.2× Wood Duck 31% of checklists here vs 10% statewide: 3.1× Nearby spots Frequency is the share of complete checklists at this location that listed the bird, 2016–2025. Busy places report more of everything, and the weekly chart counts species on at least 5% of checklists so a few stray reports do not inflate it. How to read it .
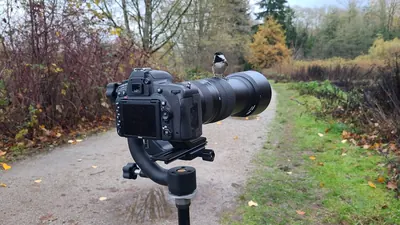 Black-capped Chickadee96%
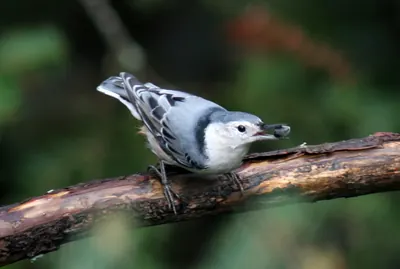 White-breasted Nuthatch93%
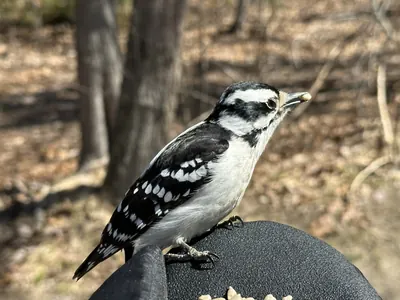 Downy Woodpecker90%
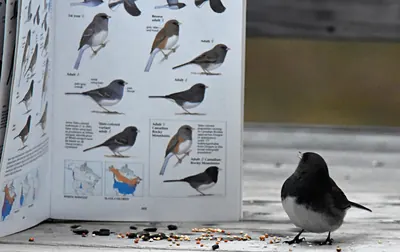 Dark-eyed Junco88%
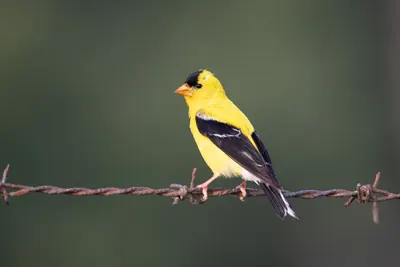 American Goldfinch83%
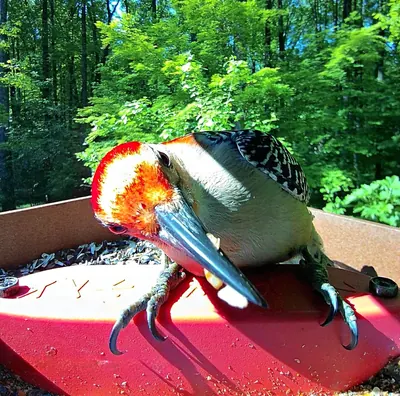 Red-bellied Woodpecker79%
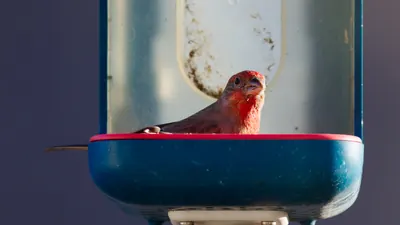 House Finch74%
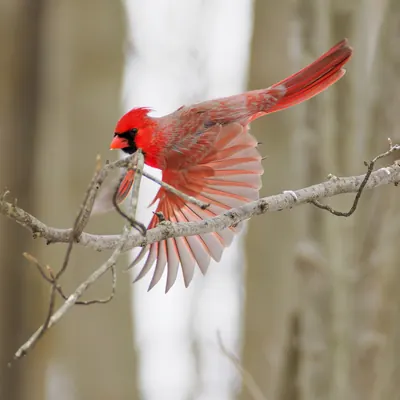 Northern Cardinal70%
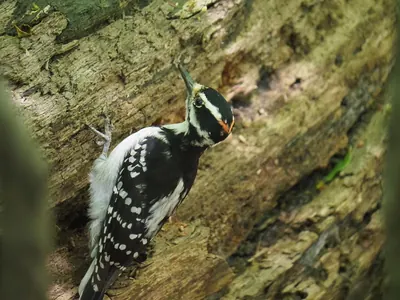 Hairy Woodpecker59%
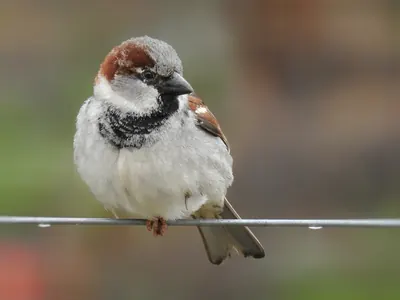 House Sparrow53%
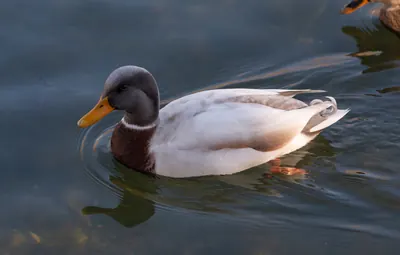 Mallard52%
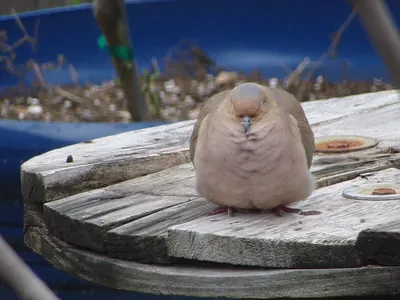 Mourning Dove47%
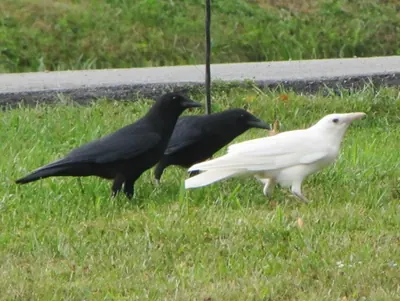 American Crow35%
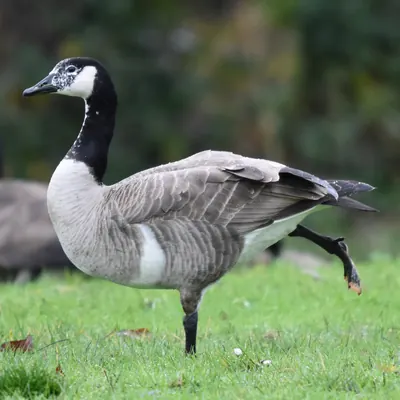 Canada Goose33%
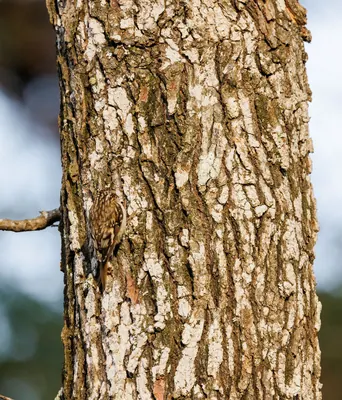 Brown Creeper27%