Birding spot · Dane County, Wisconsin
Birding at Upper Waubesa Fishery Area: What You'll See Each Week
In November, the birds most often reported at Upper Waubesa Fishery Area are Mallard (93%), Ring-billed Gull (88%), and Canada Goose (70%). It is busiest in spring, when 78 species turn up on at least 1 in 20 checklists, and species counts peak in the second week of May (88 species). 172 species have been reported here across 1,230 complete checklists from 361 birders.
Species by week
In November: what to expect
- 1
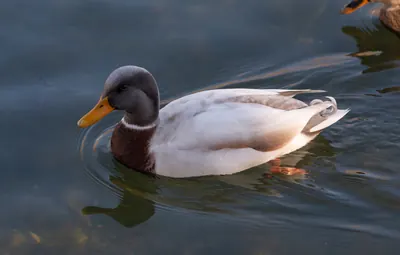 Mallard93%
- 2
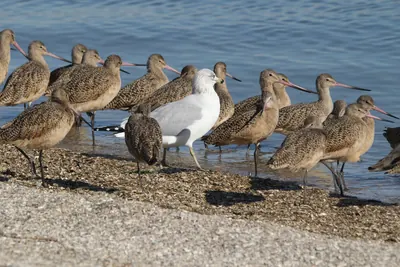 Ring-billed Gull88%
- 3
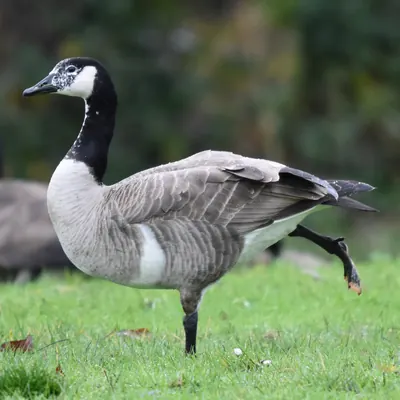 Canada Goose70%
- 4
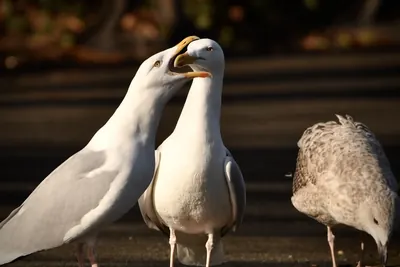 American Herring Gull63%
- 5
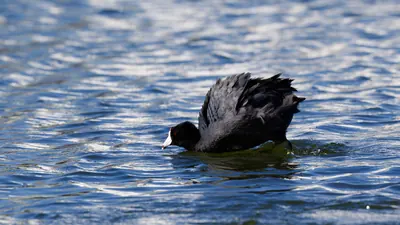 American Coot61%
- 6
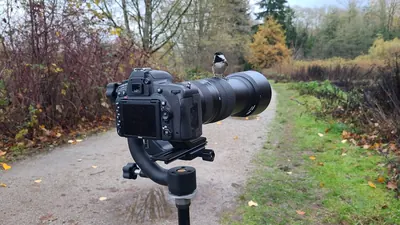 Black-capped Chickadee54%
- 7
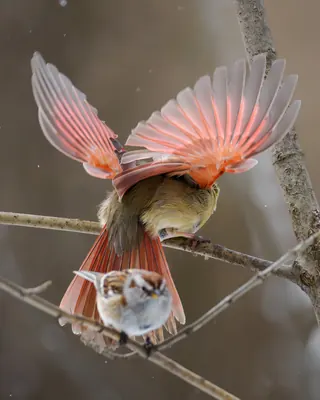 American Tree Sparrow52%
- 8
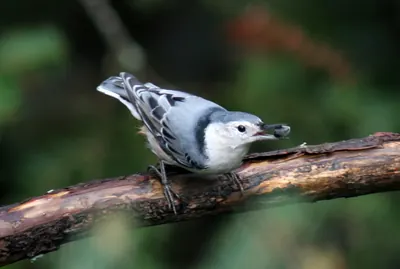 White-breasted Nuthatch52%
- 9
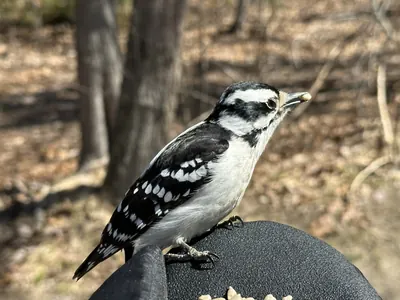 Downy Woodpecker46%
- 10
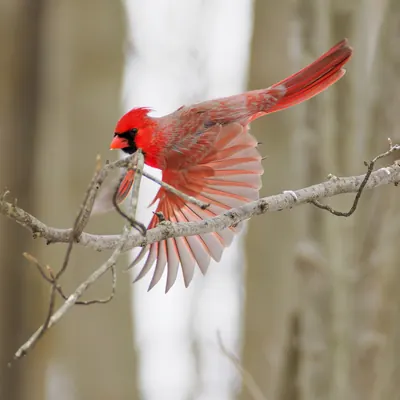 Northern Cardinal43%
- 11
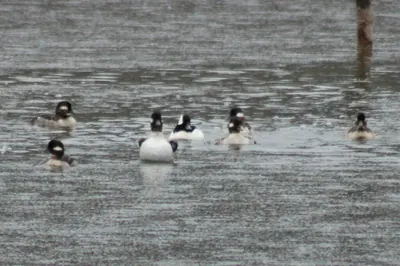 Bufflehead41%
- 12
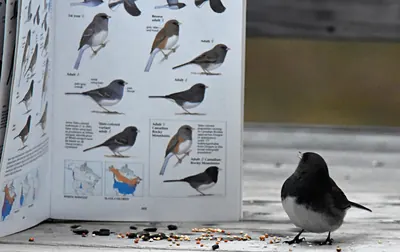 Dark-eyed Junco39%
- 13
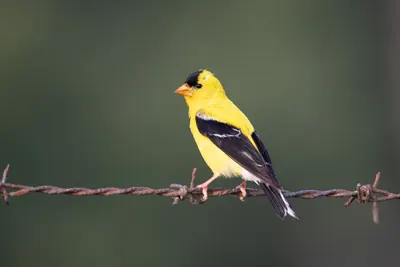 American Goldfinch38%
- 14
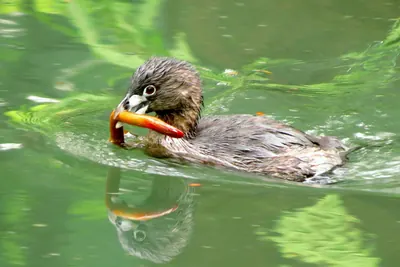 Pied-billed Grebe38%
- 15
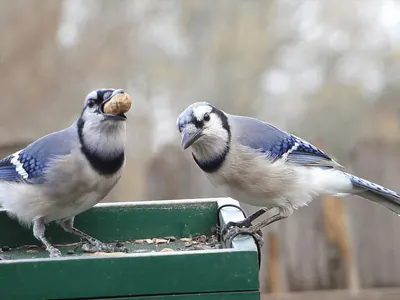 Blue Jay36%
Share of complete checklists at this spot that reported the bird in November. The sparkline is the whole year, with this month highlighted.
Season by season
Winter 46 species
Spring 78 species
Summer 67 species
Fall 64 species
Specialties
Birds reported far more often here than across Wisconsin.
- Long-tailed Duck
- Tundra Swan
- Canvasback
- Lesser Black-backed Gull
- White-winged Scoter
- Common Goldeneye
- Gadwall
- Northern Shoveler
Nearby spots
- Edna Taylor Conservation Park (2.0 km)
- Lake Waubesa (3.0 km)
- Legion Memorial Park (3.8 km)
- Turville Point Conserv Park (4.7 km)
- Yahara Place Park (6.4 km)
- Fish Camp County Park (7.4 km)
Frequency is the share of complete checklists at this location that listed the bird, 2016–2025. Busy places report more of everything, and the weekly chart counts species on at least 5% of checklists so a few stray reports do not inflate it. How to read it.