WhenToBird

Charadrius melodus · Charadriidae

When Do Piping Plovers Arrive in New Jersey?

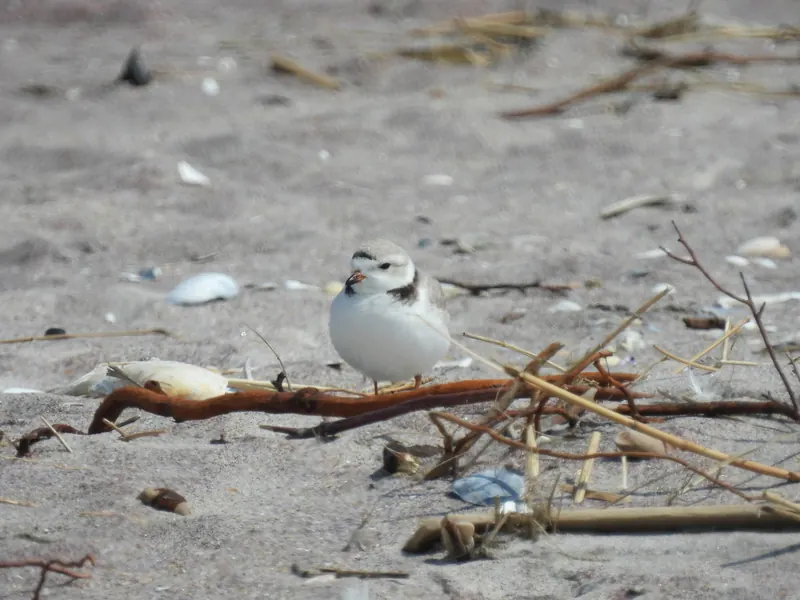
Adult Piping Plover
Photo: Caroline Quinn, CC BY 4.0 via iNaturalist

Piping Plovers arrive in New Jersey in mid March, peak in the second week of July (1.5% of checklists), and most are gone by late September.

When to look

First arrivalsMar 15-21mid March
Common byMar 15-21mid March
PeakJul 8-14the second week of July
Most gone bySep 22-30late September

Best: the second week of July. First arrivals mid March; most are gone by late September. Peak: on about 1.5% of New Jersey checklists.

  1. Jannot usually seen
  2. Febnot usually seen
  3. Marcommon
  4. Aprcommon
  5. Maycommon
  6. Junpeak season
  7. Julpeak season
  8. Augpeak season
  9. Sepcommon
  10. Octuncommon
  11. Novnot usually seen
  12. Decnot usually seen

Darker months: more checklists report it. Outlined: peak month.

0%0.5%1%1.5%2%Jan 1-7: 0.1% of 28167 checklistsJan 8-14: 0.1% of 20583 checklistsJan 15-21: 0.1% of 19739 checklistsJan 22-31: 0.1% of 24586 checklistsFeb 1-7: 0% of 17226 checklistsFeb 8-14: 0% of 19567 checklistsFeb 15-21: 0% of 26553 checklistsFeb 22-28: 0.1% of 19046 checklistsMar 1-7: 0.1% of 17969 checklistsMar 8-14: 0.3% of 18976 checklistsMar 15-21: 0.8% of 18581 checklistsMar 22-31: 1.0% of 27590 checklistsApr 1-7: 0.6% of 21202 checklistsApr 8-14: 0.5% of 23609 checklistsApr 15-21: 0.6% of 25056 checklistsApr 22-30: 0.4% of 36679 checklistsMay 1-7: 0.6% of 38378 checklistsMay 8-14: 0.7% of 44071 checklistsMay 15-21: 0.9% of 34076 checklistsMay 22-31: 1.0% of 32558 checklistsJun 1-7: 1.3% of 18049 checklistsJun 8-14: 1.0% of 15597 checklistsJun 15-21: 1.2% of 14894 checklistsJun 22-30: 1.3% of 17187 checklistsJul 1-7: 1.5% of 13406 checklistsJul 8-14: 1.5% of 12550 checklistsJul 15-21: 1.7% of 12358 checklistsJul 22-31: 1.4% of 18382 checklistsAug 1-7: 1.4% of 13689 checklistsAug 8-14: 1.5% of 14006 checklistsAug 15-21: 1.3% of 14483 checklistsAug 22-31: 1.0% of 23182 checklistsSep 1-7: 0.8% of 17984 checklistsSep 8-14: 0.7% of 18320 checklistsSep 15-21: 0.5% of 20491 checklistsSep 22-30: 0.5% of 26176 checklistsOct 1-7: 0.3% of 24112 checklistsOct 8-14: 0.2% of 24603 checklistsOct 15-21: 0.2% of 24549 checklistsOct 22-31: 0.1% of 26206 checklistsNov 1-7: 0.1% of 17469 checklistsNov 8-14: 0.1% of 15102 checklistsNov 15-21: 0% of 14958 checklistsNov 22-30: 0.1% of 19447 checklistsDec 1-7: 0% of 14017 checklistsDec 8-14: 0% of 14625 checklistsDec 15-21: 0.1% of 16937 checklistsDec 22-31: 0.1% of 26651 checklistsJanFebMarAprMayJunJulAugSepOctNovDec
Share of complete checklists reporting it, by week (4 per month). Grey bars: fewer than 10 checklists, not counted.

Frequency is the share of complete checklists in New Jersey that listed the bird, 2016–2025. It is not a head count, and it follows where and when people go birding. How to read it.

JanFebMarAprMayJunJulAugSepOctNovDec
today
Second week of November

Each county is shaded by the share of complete checklists there that listed the bird, blended with the weeks either side. Darker is more often. It follows where people watch birds, not how many birds there are. How to read it.

Embed this map on your site

Where in New Jersey

Best counties

Share of checklists at the peak
  1. Ocean CountyBest the second week of July · 1201 checklists that week, 87,340 in all6.4%
  2. Monmouth CountyBest the second week of July · 1054 checklists that week, 79,748 in all5.1%
  3. Cape May CountyBest the second week of June · 2192 checklists that week, 189,832 in all3.4%
  4. Atlantic CountyBest late July · 475 checklists that week, 28,208 in all2.4%
  5. Middlesex CountyBest late August · 1083 checklists that week, 46,761 in all0.3%
  6. Cumberland CountyBest the second week of May · 995 checklists that week, 13,927 in all0.1%

Best spots

Share of checklists at the peak
  1. Gateway National Recreation Area (Sandy Hook Channel)Monmouth County, best the second week of July · 29 checklists that week, 1,406 in all87%
  2. Barnegat Lighthouse State ParkOcean County, best the second week of June · 64 checklists that week, 6,257 in all72%
  3. Brigantine National Wilderness AreaOcean County, best late March · 21 checklists that week, 903 in all65%
  4. Gateway National Recreation Area (northwest)Monmouth County, best late March · 24 checklists that week, 608 in all65%
  5. Sand MarshCape May County, best the second week of June · 46 checklists that week, 3,777 in all63%
  6. Island Beach State Park (south)Ocean County, best late July · 21 checklists that week, 502 in all50%

Busy spots report more of everything; compare the checklist counts before you drive anywhere.

Best time of day

In New Jersey, the Piping Plover is most often listed on checklists started between 5 and 7 pm (0.7% of those checklists).

0%0.5%1%12 am: too few checklists (746) to judge1 am: too few checklists (640) to judge2 am: too few checklists (606) to judge3 am: too few checklists (755) to judge4 am: too few checklists (1681) to judge5 am: too few checklists (11258) to judge6 am: 0.8% of 50447 checklists7 am: 0.4% of 118312 checklists8 am: 0.5% of 123273 checklists9 am: 0.5% of 107783 checklists10 am: 0.5% of 97537 checklists11 am: 0.5% of 82427 checklists12 pm: 0.5% of 72581 checklists1 pm: 0.5% of 71478 checklists2 pm: 0.5% of 69994 checklists3 pm: 0.5% of 66822 checklists4 pm: 0.6% of 55950 checklists5 pm: 0.7% of 41360 checklists6 pm: 0.7% of 28122 checklists7 pm: too few checklists (14727) to judge8 pm: too few checklists (4257) to judge9 pm: too few checklists (1273) to judge10 pm: too few checklists (920) to judge11 pm: too few checklists (693) to judge12a3a6a9a12p3p6p9p
Share of checklists started in each local hour that reported it. It reflects when people go birding as well as when birds are active. Grey hours have too few checklists (under 2% of the state’s, or under 200) to judge.
Week-by-week table
MonthDays 1-78-1415-2122-end
January0.1%0.1%0.1%0.1%
February0%0%0%0.1%
March0.1%0.3%0.8%1.0%
April0.6%0.5%0.6%0.4%
May0.6%0.7%0.9%1.0%
June1.3%1.0%1.2%1.3%
July1.5%1.5%1.7%1.4%
August1.4%1.5%1.3%1.0%
September0.8%0.7%0.5%0.5%
October0.3%0.2%0.2%0.1%
November0.1%0.1%0%0.1%
December0%0%0.1%0.1%

Neighboring states

  • Delaware: arrives mid March, in the same week than New Jersey
  • Connecticut: arrives mid March, in the same week than New Jersey
  • New York: arrives mid May, 8 weeks later than New Jersey
  • Rhode Island: arrives the second week of March, 1 week earlier than New Jersey

Common questions

When do Piping Plovers arrive in New Jersey?
Piping Plovers arrive in New Jersey in mid March, peak in the second week of July (1.5% of checklists), and most are gone by late September.
When do Piping Plovers leave New Jersey?
Most Piping Plovers have left New Jersey by late September, when reports fall below half their usual rate.
When is the best time to see a Piping Plover in New Jersey?
The Piping Plover is reported most often in the second week of July, on about 1.5% of New Jersey checklists.
Where in New Jersey are Piping Plovers seen most often?
By county, Ocean County, Monmouth County, and Cape May County have the highest peak reporting rates for the Piping Plover (counties with at least 200 checklists).