WhenToBird

Charadrius melodus · Charadriidae

When Do Piping Plovers Arrive in New York?

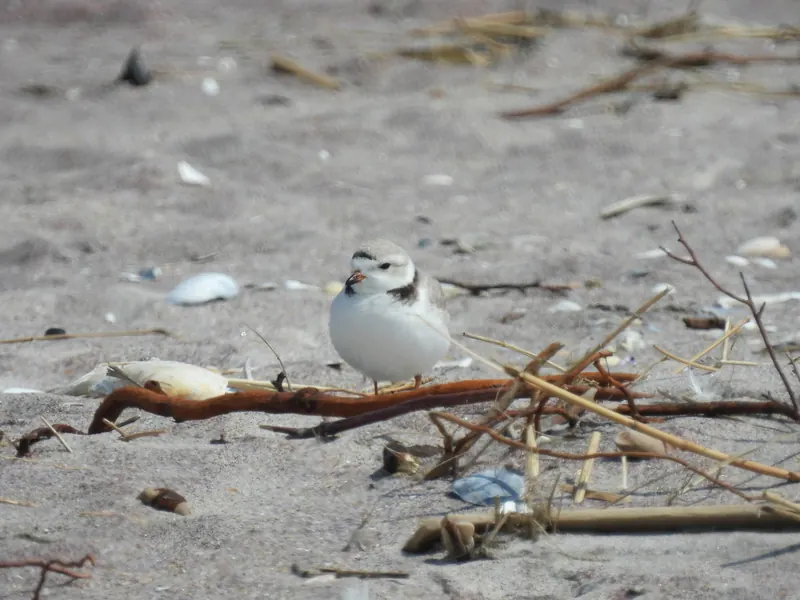
Adult Piping Plover
Photo: Caroline Quinn, CC BY 4.0 via iNaturalist

Piping Plovers arrive in New York in mid May, peak in late July (1.6% of checklists), and most are gone by late August.

When to look

First arrivalsMay 15-21mid May
Common byMay 15-21mid May
PeakJul 22-31late July
Most gone byAug 22-31late August

Best: late July. First arrivals mid May; most are gone by late August. Peak: on about 1.6% of New York checklists.

  1. Jannot usually seen
  2. Febnot usually seen
  3. Maruncommon
  4. Apruncommon
  5. Maycommon
  6. Junpeak season
  7. Julpeak season
  8. Augpeak season
  9. Sepuncommon
  10. Octnot usually seen
  11. Novnot usually seen
  12. Decnot usually seen

Darker months: more checklists report it. Outlined: peak month.

0%0.5%1%1.5%2%Jan 1-7: 0.1% of 66410 checklistsJan 8-14: 0.1% of 49310 checklistsJan 15-21: 0.1% of 49919 checklistsJan 22-31: 0.1% of 62513 checklistsFeb 1-7: 0.1% of 43526 checklistsFeb 8-14: 0.1% of 49753 checklistsFeb 15-21: 0% of 65147 checklistsFeb 22-28: 0.1% of 50173 checklistsMar 1-7: 0.1% of 50325 checklistsMar 8-14: 0.1% of 55371 checklistsMar 15-21: 0.3% of 56293 checklistsMar 22-31: 0.4% of 82677 checklistsApr 1-7: 0.3% of 65295 checklistsApr 8-14: 0.3% of 73080 checklistsApr 15-21: 0.3% of 73857 checklistsApr 22-30: 0.3% of 106093 checklistsMay 1-7: 0.3% of 102772 checklistsMay 8-14: 0.4% of 110051 checklistsMay 15-21: 0.6% of 94797 checklistsMay 22-31: 1.2% of 101272 checklistsJun 1-7: 1.5% of 59471 checklistsJun 8-14: 1.5% of 55497 checklistsJun 15-21: 1.4% of 51761 checklistsJun 22-30: 1.1% of 59219 checklistsJul 1-7: 1.1% of 48226 checklistsJul 8-14: 1.3% of 42315 checklistsJul 15-21: 1.6% of 40637 checklistsJul 22-31: 1.7% of 57183 checklistsAug 1-7: 1.4% of 40461 checklistsAug 8-14: 1.2% of 39880 checklistsAug 15-21: 0.9% of 41146 checklistsAug 22-31: 0.7% of 63381 checklistsSep 1-7: 0.4% of 48640 checklistsSep 8-14: 0.2% of 47882 checklistsSep 15-21: 0.1% of 49063 checklistsSep 22-30: 0.1% of 57906 checklistsOct 1-7: 0.1% of 48447 checklistsOct 8-14: 0.1% of 51901 checklistsOct 15-21: 0.1% of 46717 checklistsOct 22-31: 0.1% of 61992 checklistsNov 1-7: 0.1% of 44593 checklistsNov 8-14: 0% of 42566 checklistsNov 15-21: 0.1% of 39675 checklistsNov 22-30: 0.1% of 51197 checklistsDec 1-7: 0.1% of 36567 checklistsDec 8-14: 0.1% of 37254 checklistsDec 15-21: 0.1% of 43754 checklistsDec 22-31: 0.1% of 62470 checklistsJanFebMarAprMayJunJulAugSepOctNovDec
Share of complete checklists reporting it, by week (4 per month). Grey bars: fewer than 10 checklists, not counted.

Frequency is the share of complete checklists in New York that listed the bird, 2016–2025. It is not a head count, and it follows where and when people go birding. How to read it.

JanFebMarAprMayJunJulAugSepOctNovDec
today
Second week of November

Each county is shaded by the share of complete checklists there that listed the bird, blended with the weeks either side. Darker is more often. It follows where people watch birds, not how many birds there are. How to read it.

Embed this map on your site

Where in New York

Best counties

Share of checklists at the peak
  1. Nassau CountyBest the second week of June · 1963 checklists that week, 95,019 in all20%
  2. Suffolk CountyBest mid July · 3038 checklists that week, 208,865 in all12%
  3. Queens CountyBest mid July · 1071 checklists that week, 76,201 in all7.4%
  4. Kings CountyBest early August · 1454 checklists that week, 134,897 in all5.5%
  5. Oswego CountyBest early June · 847 checklists that week, 39,208 in all1.6%
  6. Rockland CountyBest mid July · 577 checklists that week, 35,579 in all1.0%

Best spots

Share of checklists at the peak
  1. Gateway National Recreation AreaQueens County, best the second week of July · 29 checklists that week, 1,841 in all92%
  2. W Scott Cameron Town BeachSuffolk County, best mid June · 23 checklists that week, 1,158 in all90%
  3. Nassau Beach County ParkNassau County, best mid June · 286 checklists that week, 3,307 in all83%
  4. Georgica PondSuffolk County, best early June · 46 checklists that week, 297 in all82%
  5. Rockaway Beach and BoardwalkQueens County, best late May · 30 checklists that week, 489 in all81%

Busy spots report more of everything; compare the checklist counts before you drive anywhere.

Best time of day

In New York, the Piping Plover is most often listed on checklists started between 6 and 8 am (0.6% of those checklists).

0%0.5%1%12 am: too few checklists (1146) to judge1 am: too few checklists (1055) to judge2 am: too few checklists (1121) to judge3 am: too few checklists (1353) to judge4 am: too few checklists (4785) to judge5 am: too few checklists (32052) to judge6 am: 0.9% of 124869 checklists7 am: 0.5% of 298506 checklists8 am: 0.5% of 337334 checklists9 am: 0.4% of 307787 checklists10 am: 0.4% of 270801 checklists11 am: 0.4% of 233238 checklists12 pm: 0.3% of 213830 checklists1 pm: 0.4% of 193321 checklists2 pm: 0.3% of 180741 checklists3 pm: 0.3% of 170348 checklists4 pm: 0.4% of 147224 checklists5 pm: 0.4% of 111962 checklists6 pm: 0.5% of 78261 checklists7 pm: too few checklists (44425) to judge8 pm: too few checklists (15648) to judge9 pm: too few checklists (4795) to judge10 pm: too few checklists (2454) to judge11 pm: too few checklists (1378) to judge12a3a6a9a12p3p6p9p
Share of checklists started in each local hour that reported it. It reflects when people go birding as well as when birds are active. Grey hours have too few checklists (under 2% of the state’s, or under 200) to judge.
Week-by-week table
MonthDays 1-78-1415-2122-end
January0.1%0.1%0.1%0.1%
February0.1%0.1%0%0.1%
March0.1%0.1%0.3%0.4%
April0.3%0.3%0.3%0.3%
May0.3%0.4%0.6%1.2%
June1.5%1.5%1.4%1.1%
July1.1%1.3%1.6%1.7%
August1.4%1.2%0.9%0.7%
September0.4%0.2%0.1%0.1%
October0.1%0.1%0.1%0.1%
November0.1%0%0.1%0.1%
December0.1%0.1%0.1%0.1%

Neighboring states

  • Connecticut: arrives mid March, 8 weeks earlier than New York
  • New Jersey: arrives mid March, 8 weeks earlier than New York
  • Delaware: arrives mid March, 8 weeks earlier than New York
  • Rhode Island: arrives the second week of March, 9 weeks earlier than New York

Common questions

When do Piping Plovers arrive in New York?
Piping Plovers arrive in New York in mid May, peak in late July (1.6% of checklists), and most are gone by late August.
When do Piping Plovers leave New York?
Most Piping Plovers have left New York by late August, when reports fall below half their usual rate.
When is the best time to see a Piping Plover in New York?
The Piping Plover is reported most often in late July, on about 1.6% of New York checklists.
Where in New York are Piping Plovers seen most often?
By county, Nassau County, Suffolk County, and Queens County have the highest peak reporting rates for the Piping Plover (counties with at least 200 checklists).