WhenToBird

Calidris alba · Scolopacidae

When Do Sanderlings Arrive in California?

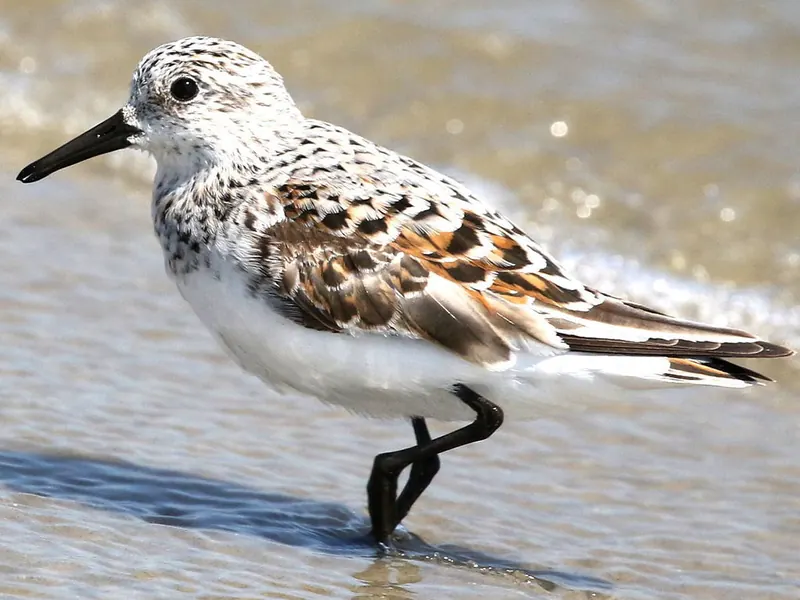
Adult Sanderling
Photo: Peter Chen 2.0, CC BY 4.0 via iNaturalist

Sanderlings are winter birds in California: the first arrive in mid July, they are common by late July, peak in the second week of January (3.5% of checklists), and most are gone by early May.

When to look

First arrivalsJul 15-21mid July
Common byJul 22-31late July
PeakJan 8-14the second week of January
Most gone byMay 1-7early May

Best: the second week of January. First arrivals mid July; most are gone by early May. Peak: on about 3.5% of California checklists.

  1. Janpeak season
  2. Febpeak season
  3. Marcommon
  4. Apruncommon
  5. Mayuncommon
  6. Junrare
  7. Julcommon
  8. Augcommon
  9. Sepcommon
  10. Octcommon
  11. Novpeak season
  12. Decpeak season

Darker months: more checklists report it. Outlined: peak month.

0%1%2%3%4%Jan 1-7: 3.5% of 112336 checklistsJan 8-14: 3.5% of 85518 checklistsJan 15-21: 3.6% of 86488 checklistsJan 22-31: 3.3% of 116174 checklistsFeb 1-7: 2.9% of 75171 checklistsFeb 8-14: 2.5% of 84467 checklistsFeb 15-21: 2.3% of 105683 checklistsFeb 22-28: 2.4% of 83396 checklistsMar 1-7: 2.3% of 77470 checklistsMar 8-14: 1.8% of 75180 checklistsMar 15-21: 1.6% of 80770 checklistsMar 22-31: 1.4% of 114116 checklistsApr 1-7: 1.3% of 84057 checklistsApr 8-14: 1.4% of 83692 checklistsApr 15-21: 1.3% of 89242 checklistsApr 22-30: 1.3% of 114289 checklistsMay 1-7: 1.4% of 85728 checklistsMay 8-14: 1.0% of 91984 checklistsMay 15-21: 0.7% of 75478 checklistsMay 22-31: 0.3% of 106250 checklistsJun 1-7: 0.1% of 70051 checklistsJun 8-14: 0.1% of 67485 checklistsJun 15-21: 0.1% of 66269 checklistsJun 22-30: 0.1% of 79172 checklistsJul 1-7: 0.1% of 62877 checklistsJul 8-14: 0.3% of 60328 checklistsJul 15-21: 1.0% of 59705 checklistsJul 22-31: 1.7% of 83796 checklistsAug 1-7: 1.9% of 60215 checklistsAug 8-14: 2.4% of 60172 checklistsAug 15-21: 2.5% of 59877 checklistsAug 22-31: 2.7% of 89107 checklistsSep 1-7: 2.4% of 72000 checklistsSep 8-14: 2.2% of 71228 checklistsSep 15-21: 2.1% of 76808 checklistsSep 22-30: 2.0% of 100204 checklistsOct 1-7: 2.0% of 76571 checklistsOct 8-14: 2.1% of 80874 checklistsOct 15-21: 2.4% of 74581 checklistsOct 22-31: 2.7% of 97498 checklistsNov 1-7: 2.6% of 70851 checklistsNov 8-14: 2.9% of 72431 checklistsNov 15-21: 2.8% of 66767 checklistsNov 22-30: 3.1% of 94737 checklistsDec 1-7: 2.9% of 65393 checklistsDec 8-14: 3.0% of 67449 checklistsDec 15-21: 2.6% of 83421 checklistsDec 22-31: 3.2% of 124993 checklistsJanFebMarAprMayJunJulAugSepOctNovDec
Share of complete checklists reporting it, by week (4 per month). Grey bars: fewer than 10 checklists, not counted.

Frequency is the share of complete checklists in California that listed the bird, 2016–2025. It is not a head count, and it follows where and when people go birding. How to read it.

JanFebMarAprMayJunJulAugSepOctNovDec
today
Second week of November

Each county is shaded by the share of complete checklists there that listed the bird, blended with the weeks either side. Darker is more often. It follows where people watch birds, not how many birds there are. How to read it.

Embed this map on your site

Where in California

Best counties

Share of checklists at the peak
  1. Del Norte CountyBest mid November · 211 checklists that week, 16,363 in all12%
  2. Santa Cruz CountyBest the second week of January · 3171 checklists that week, 140,819 in all12%
  3. Monterey CountyBest mid January · 2590 checklists that week, 132,505 in all11%
  4. Ventura CountyBest mid January · 2084 checklists that week, 94,391 in all9.0%
  5. San Luis Obispo CountyBest late January · 3642 checklists that week, 124,667 in all8.2%
  6. Santa Barbara CountyBest late January · 3519 checklists that week, 120,616 in all8.1%

Best spots

Share of checklists at the peak
  1. Campus Lagoon (Goleta Point)Santa Barbara County, best early October · 20 checklists that week, 505 in all98%
  2. Ocean BeachSan Francisco County, best late April · 55 checklists that week, 1,391 in all93%
  3. Coal Oil Point Natural ReserveSanta Barbara County, best the second week of September · 84 checklists that week, 2,974 in all90%
  4. Dockweiler State BeachLos Angeles County, best mid January · 23 checklists that week, 753 in all89%
  5. Crown Memorial Regional ShorelineAlameda County, best mid October · 61 checklists that week, 3,508 in all87%
  6. North Moss BeachMonterey County, best mid January · 22 checklists that week, 1,248 in all84%

Busy spots report more of everything; compare the checklist counts before you drive anywhere.

Best time of day

In California, the Sanderling is most often listed on checklists started between 1 and 3 pm (2.5% of those checklists).

0%1%2%3%12 am: too few checklists (1688) to judge1 am: too few checklists (1451) to judge2 am: too few checklists (1402) to judge3 am: too few checklists (1743) to judge4 am: too few checklists (4647) to judge5 am: too few checklists (32158) to judge6 am: 1.4% of 186053 checklists7 am: 2.0% of 444086 checklists8 am: 2.0% of 535846 checklists9 am: 2.1% of 486061 checklists10 am: 2.2% of 411130 checklists11 am: 2.2% of 325798 checklists12 pm: 2.3% of 269132 checklists1 pm: 2.5% of 244762 checklists2 pm: 2.4% of 235420 checklists3 pm: 2.3% of 232365 checklists4 pm: 1.9% of 208688 checklists5 pm: 1.4% of 146104 checklists6 pm: 1.0% of 96867 checklists7 pm: too few checklists (50942) to judge8 pm: too few checklists (14803) to judge9 pm: too few checklists (5561) to judge10 pm: too few checklists (3546) to judge11 pm: too few checklists (2092) to judge12a3a6a9a12p3p6p9p
Share of checklists started in each local hour that reported it. It reflects when people go birding as well as when birds are active. Grey hours have too few checklists (under 2% of the state’s, or under 200) to judge.
Week-by-week table
MonthDays 1-78-1415-2122-end
January3.5%3.5%3.6%3.3%
February2.9%2.5%2.3%2.4%
March2.3%1.8%1.6%1.4%
April1.3%1.4%1.3%1.3%
May1.4%1.0%0.7%0.3%
June0.1%0.1%0.1%0.1%
July0.1%0.3%1.0%1.7%
August1.9%2.4%2.5%2.7%
September2.4%2.2%2.1%2.0%
October2.0%2.1%2.4%2.7%
November2.6%2.9%2.8%3.1%
December2.9%3.0%2.6%3.2%

Neighboring states

  • Oregon: arrives mid July, in the same week than California
  • Washington: arrives mid July, in the same week than California
  • Colorado: arrives early August, 2 weeks later than California
  • South Dakota: arrives mid April, 12 weeks earlier than California

Common questions

When do Sanderlings arrive in California?
Sanderlings are winter birds in California: the first arrive in mid July, they are common by late July, peak in the second week of January (3.5% of checklists), and most are gone by early May.
When do Sanderlings leave California?
Most Sanderlings have left California by early May, when reports fall below half their usual rate. Stragglers are still reported until the second week of May.
When is the best time to see a Sanderling in California?
The Sanderling is reported most often in the second week of January, on about 3.5% of California checklists.
Where in California are Sanderlings seen most often?
By county, Del Norte County, Santa Cruz County, and Monterey County have the highest peak reporting rates for the Sanderling (counties with at least 200 checklists).