Birding spot · San Luis Obispo County, California
Birding at East Fork Morro Creek: What You'll See Each Week
In November, the birds most often reported at East Fork Morro Creek are Steller's Jay (89%), Ruby-crowned Kinglet (86%), and Wrentit (84%). It is busiest in spring, when 65 species turn up on at least 1 in 20 checklists, and species counts peak in mid April (67 species). 121 species have been reported here across 1,449 complete checklists from 357 birders.
Species by week
In November: what to expect
- 1
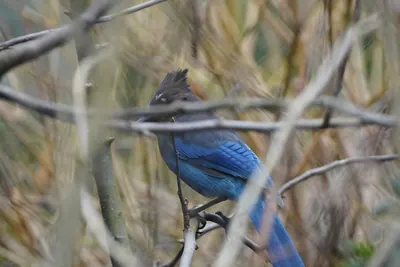 Steller's Jay89%
- 2
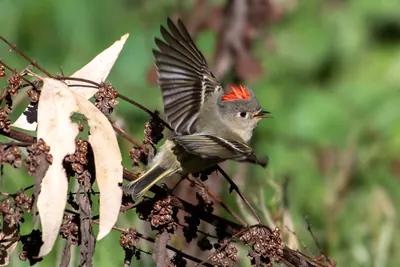 Ruby-crowned Kinglet86%
- 3
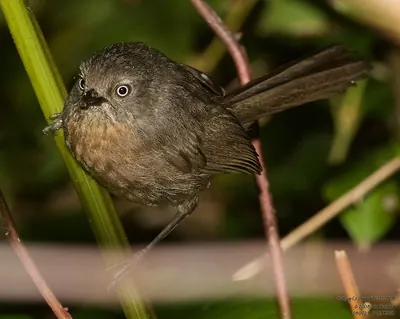 Wrentit84%
- 4
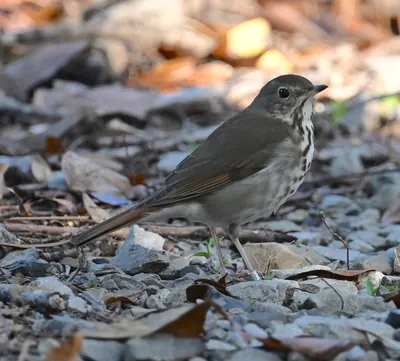 Hermit Thrush78%
- 5
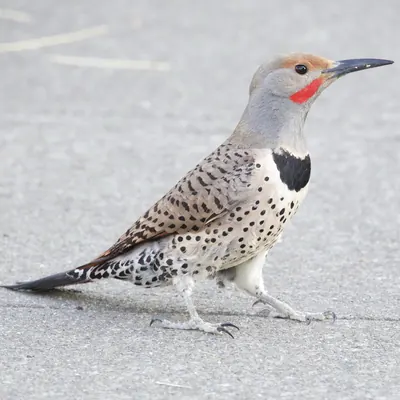 Northern Flicker75%
- 6
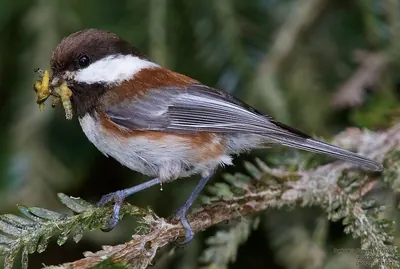 Chestnut-backed Chickadee73%
- 7
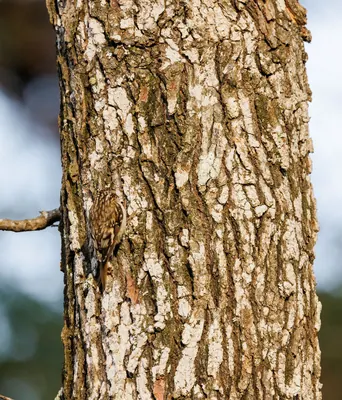 Brown Creeper70%
- 8
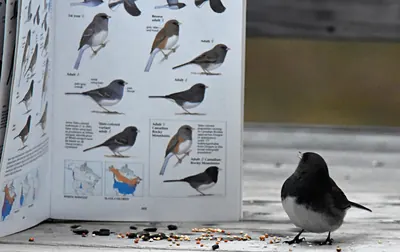 Dark-eyed Junco66%
- 9
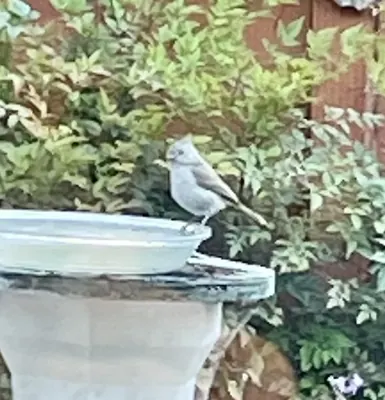 Oak Titmouse66%
- 10
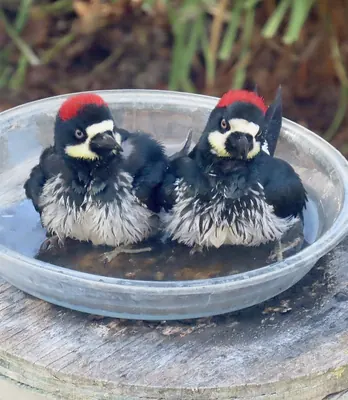 Acorn Woodpecker64%
- 11
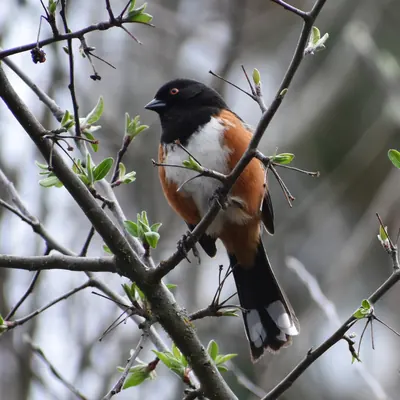 Spotted Towhee63%
- 12
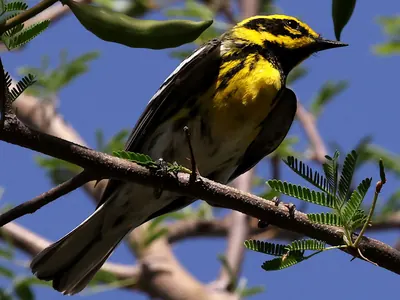 Townsend's Warbler61%
- 13
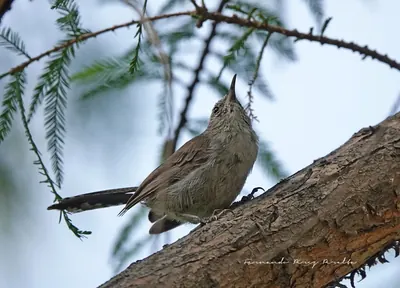 Bewick's Wren53%
- 14
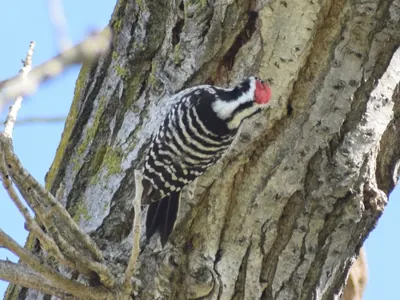 Nuttall's Woodpecker53%
- 15
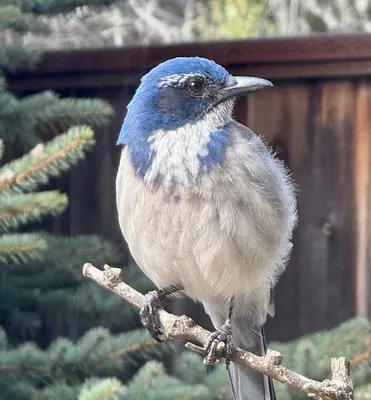 California Scrub-Jay50%
Share of complete checklists at this spot that reported the bird in November. The sparkline is the whole year, with this month highlighted.
Season by season
Winter 44 species
Spring 65 species
Summer 52 species
Fall 55 species
Specialties
Birds reported far more often here than across California.
- Northern Pygmy-Owl
- Mountain Quail
- Olive-sided Flycatcher
- MacGillivray's Warbler
- Brown Creeper
- Varied Thrush
- Western Warbling Vireo
- Hermit Warbler
Nearby spots
- Atascadero Lake (8.5 km)
- El Chorro Regional Park and Dairy Creek Golf Course (10.6 km)
- Morro Strand State Beach (11.2 km)
- Morro Bay City Beach (11.7 km)
- Whale Rock Reservoir (11.7 km)
- Morro Bay State Park (southeast) (12.1 km)
Frequency is the share of complete checklists at this location that listed the bird, 2016–2025. Busy places report more of everything, and the weekly chart counts species on at least 5% of checklists so a few stray reports do not inflate it. How to read it.