Birding spot · Alameda County, California
Birding at Jordan Pond: What You'll See Each Week
In November, the birds most often reported at Jordan Pond are California Scrub-Jay (87%), Black Phoebe (85%), and California Towhee (83%). It is busiest in spring, when 81 species turn up on at least 1 in 20 checklists, and species counts peak in the second week of April (86 species). 142 species have been reported here across 943 complete checklists from 298 birders.
Species by week
In November: what to expect
- 1
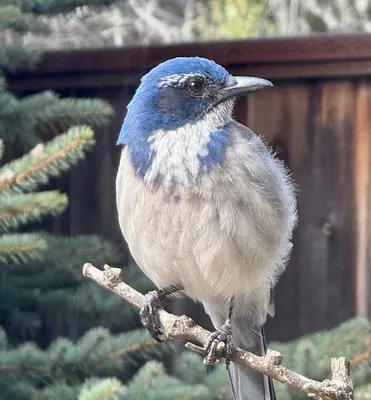 California Scrub-Jay87%
- 2
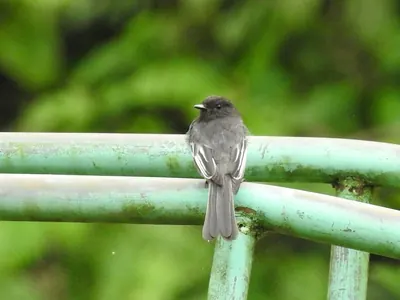 Black Phoebe85%
- 3
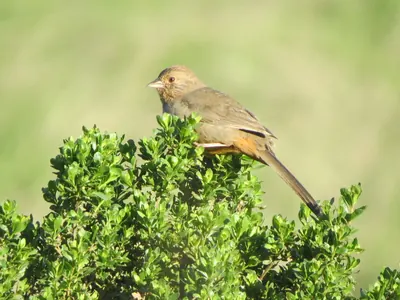 California Towhee83%
- 4
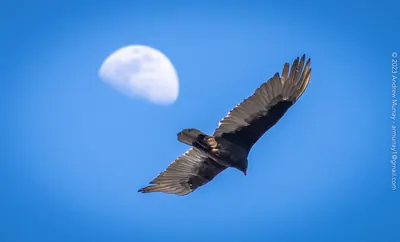 Turkey Vulture79%
- 5
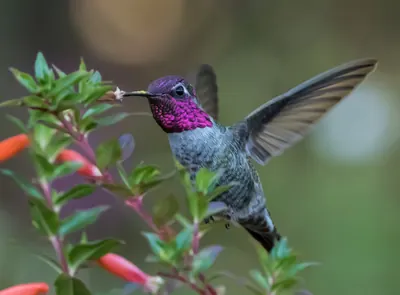 Anna's Hummingbird77%
- 6
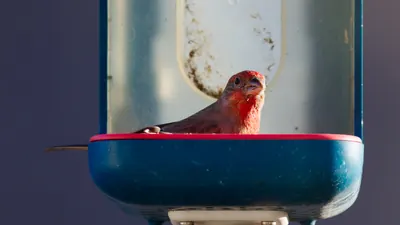 House Finch76%
- 7
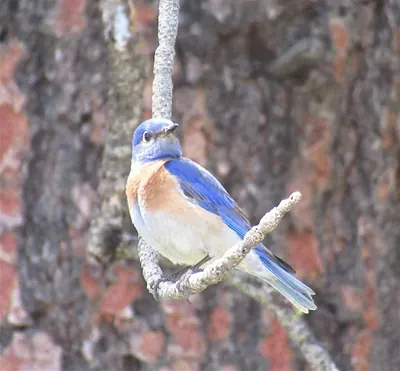 Western Bluebird74%
- 8
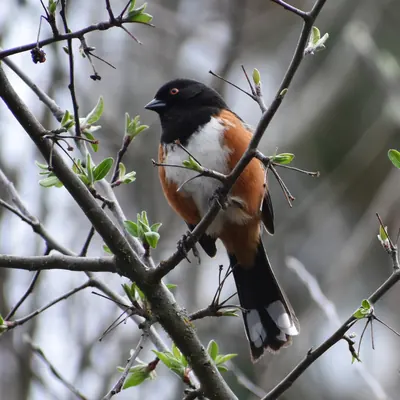 Spotted Towhee71%
- 9
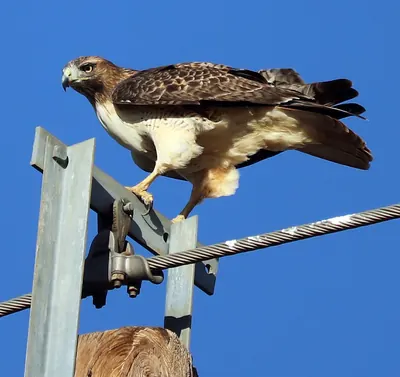 Red-tailed Hawk71%
- 10
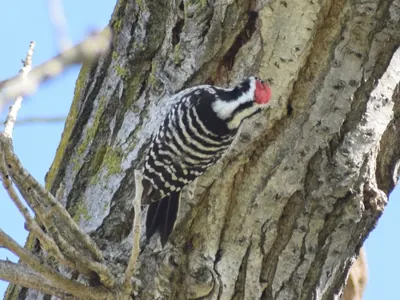 Nuttall's Woodpecker71%
- 11
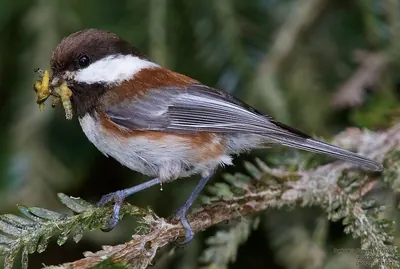 Chestnut-backed Chickadee68%
- 12
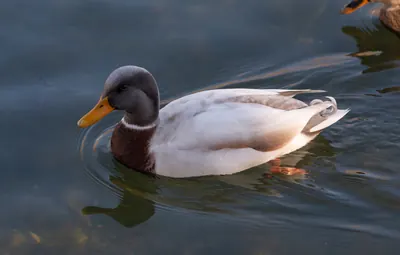 Mallard68%
- 13
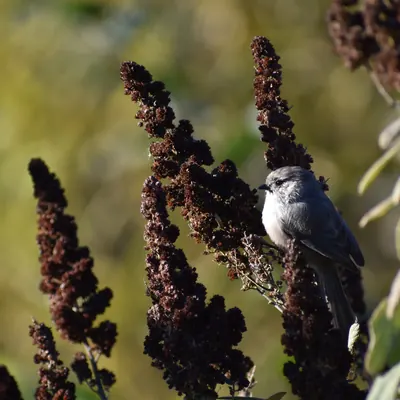 Bushtit66%
- 14
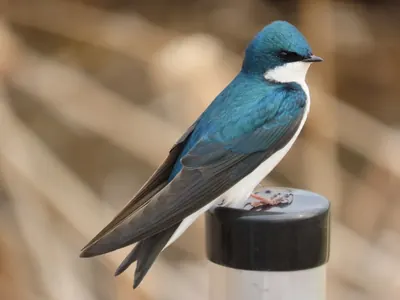 Tree Swallow66%
- 15
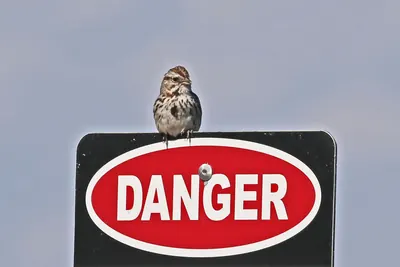 Song Sparrow66%
Share of complete checklists at this spot that reported the bird in November. The sparkline is the whole year, with this month highlighted.
Season by season
Winter 61 species
Spring 81 species
Summer 69 species
Fall 57 species
Specialties
Birds reported far more often here than across California.
- Grasshopper Sparrow
- Lazuli Bunting
- Bullock's Oriole
- Wild Turkey
- Tree Swallow
- Western Flycatcher
- Ash-throated Flycatcher
- Western Warbling Vireo
Nearby spots
- Don Castro Regional Recreation Area (7.3 km)
- Ardenwood Historic Farm (8.5 km)
- Coyote Hills Regional Park (9.8 km)
- Hayward Regional Shoreline (Russell City) (10.6 km)
- Fremont Central Park (10.7 km)
- Hayward Regional Shoreline (11.0 km)
Frequency is the share of complete checklists at this location that listed the bird, 2016–2025. Busy places report more of everything, and the weekly chart counts species on at least 5% of checklists so a few stray reports do not inflate it. How to read it.