Birding spot · Monterey County, California
Birding at Salinas River National Wildlife Refuge: What You'll See Each Week
In November, the birds most often reported at Salinas River National Wildlife Refuge are Black Phoebe (90%), White-crowned Sparrow (82%), and Northern Harrier (79%). It is busiest in fall, when 109 species turn up on at least 1 in 20 checklists, and species counts peak in late February (120 species). 207 species have been reported here across 1,209 complete checklists from 630 birders.
Species by week
In November: what to expect
- 1
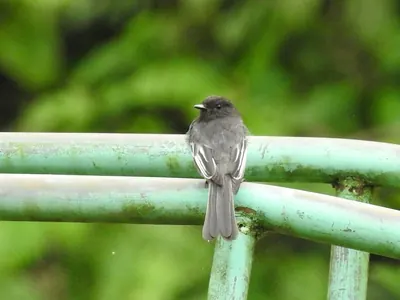 Black Phoebe90%
- 2
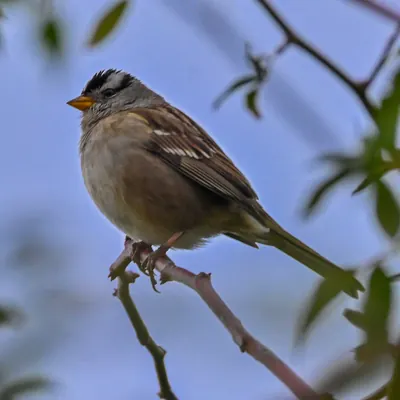 White-crowned Sparrow82%
- 3Northern Harrier79%
- 4
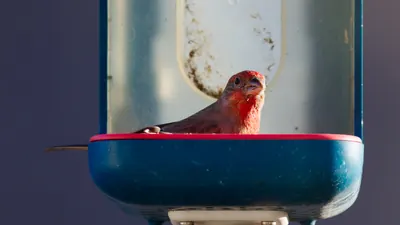 House Finch76%
- 5
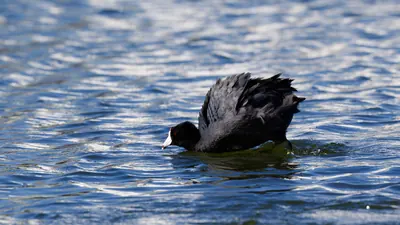 American Coot72%
- 6
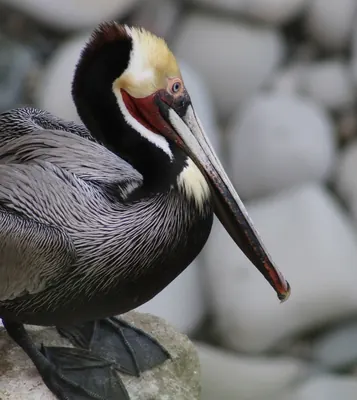 Brown Pelican72%
- 7
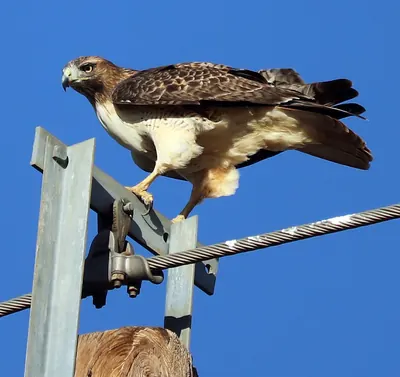 Red-tailed Hawk72%
- 8
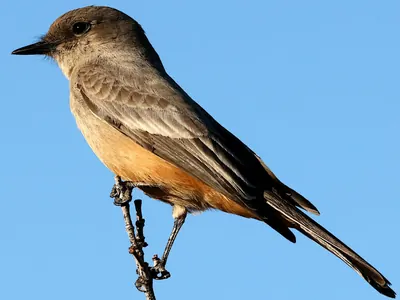 Say's Phoebe66%
- 9
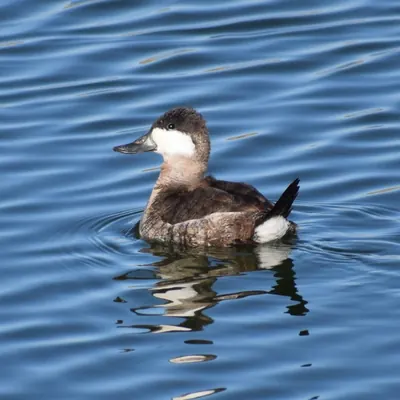 Ruddy Duck64%
- 10
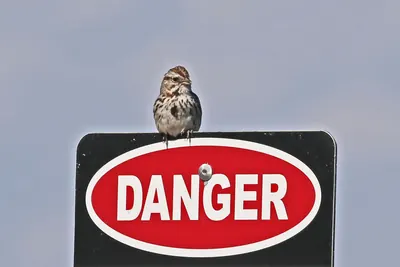 Song Sparrow63%
- 11
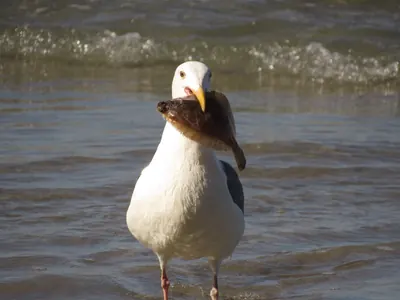 Western Gull62%
- 12
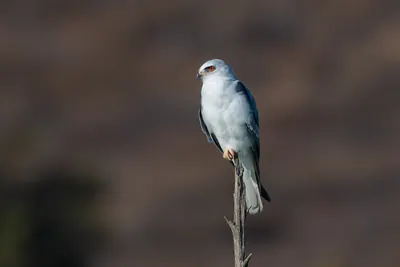 White-tailed Kite60%
- 13
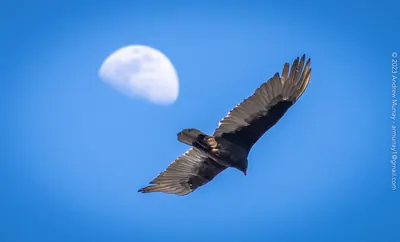 Turkey Vulture57%
- 14
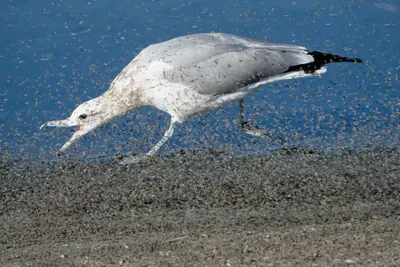 California Gull56%
- 15
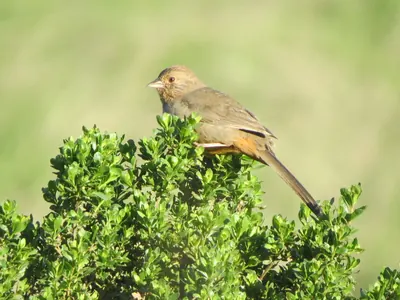 California Towhee56%
Share of complete checklists at this spot that reported the bird in November. The sparkline is the whole year, with this month highlighted.
Season by season
Winter 106 species
Spring 99 species
Summer 85 species
- Barn Swallow92%
- House Finch83%
- Brown Pelican77%
- Song Sparrow75%
- Caspian Tern68%
Fall 109 species
Specialties
Birds reported far more often here than across California.
- Sprague's Pipit
- Red-necked Phalarope
- Snowy Plover
- Wilson's Phalarope
- Sanderling
- Short-billed Dowitcher
- Caspian Tern
- Northern Harrier
Nearby spots
- Locke Paddon Park (4.9 km)
- Moss Landing State Beach (8.9 km)
- Elkhorn Slough Ecological Reserve (west) (8.9 km)
- Moss Landing Wildlife Area (9.3 km)
- Elkhorn Slough Ecological Reserve (10.9 km)
- McClusky Slough (11.3 km)
Frequency is the share of complete checklists at this location that listed the bird, 2016–2025. Busy places report more of everything, and the weekly chart counts species on at least 5% of checklists so a few stray reports do not inflate it. How to read it.