Birding spot · Orange County, California
Birding at University of California, Irvine Open Space Reserve: What You'll See Each Week
In November, the birds most often reported at University of California, Irvine Open Space Reserve are White-crowned Sparrow (92%), American Crow (87%), and California Towhee (82%). It is busiest in spring, when 63 species turn up on at least 1 in 20 checklists, and species counts peak in early May (64 species). 120 species have been reported here across 814 complete checklists from 260 birders.
Species by week
In November: what to expect
- 1
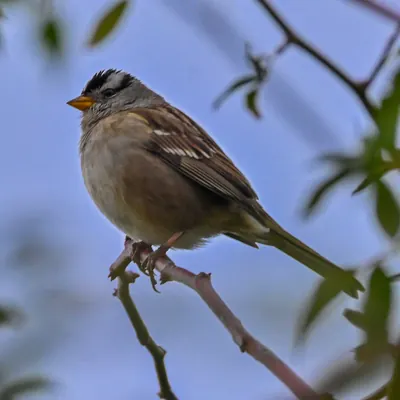 White-crowned Sparrow92%
- 2
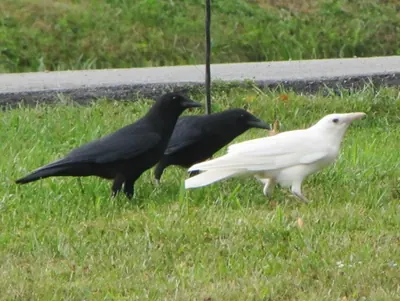 American Crow87%
- 3
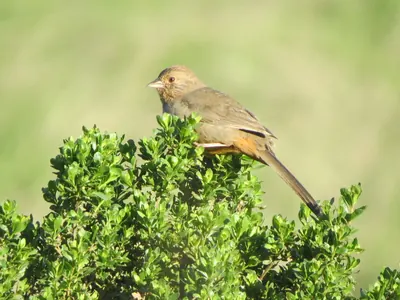 California Towhee82%
- 4
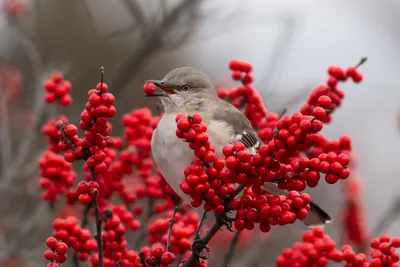 Northern Mockingbird80%
- 5
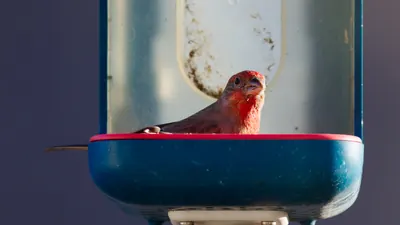 House Finch76%
- 6
 Yellow-rumped Warbler73%
- 7
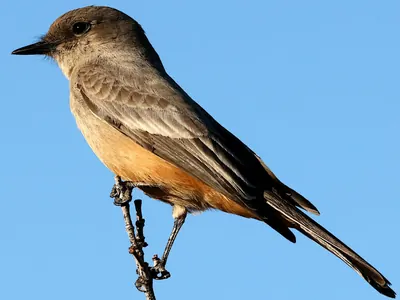 Say's Phoebe72%
- 8
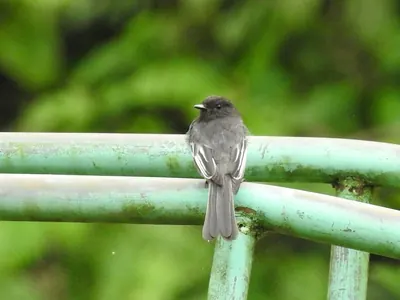 Black Phoebe62%
- 9California Gnatcatcher62%
- 10
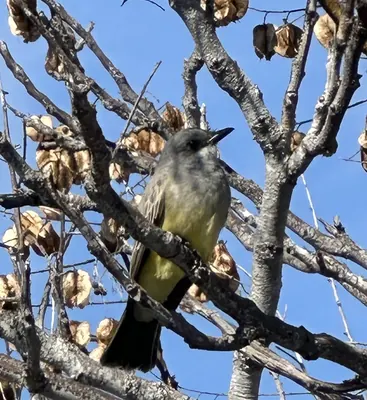 Cassin's Kingbird61%
- 11
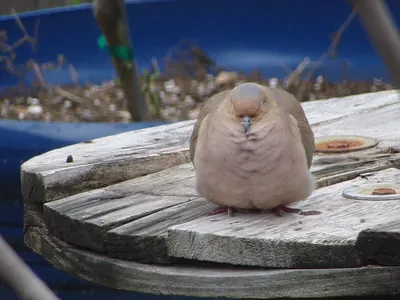 Mourning Dove57%
- 12
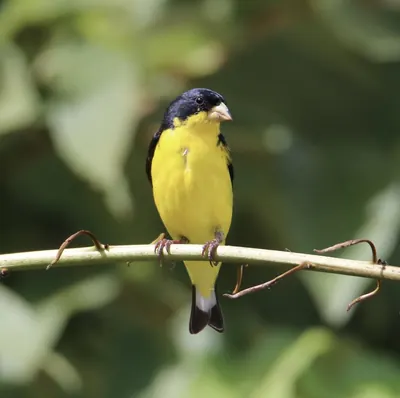 Lesser Goldfinch56%
- 13
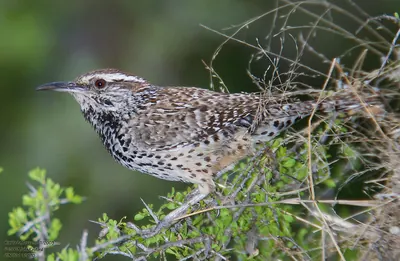 Cactus Wren53%
- 14
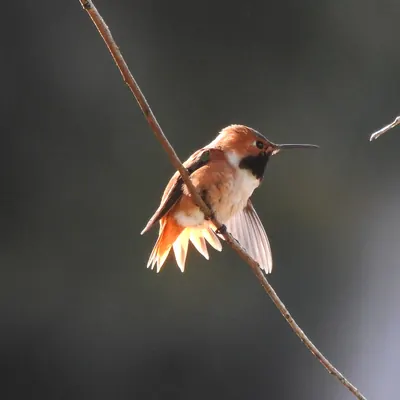 Allen's Hummingbird48%
- 15
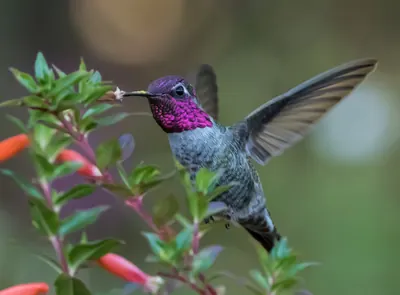 Anna's Hummingbird46%
Share of complete checklists at this spot that reported the bird in November. The sparkline is the whole year, with this month highlighted.
Season by season
Winter 53 species
Spring 63 species
Summer 45 species
Fall 49 species
Specialties
Birds reported far more often here than across California.
- Cactus Wren
- California Gnatcatcher
- Greater Roadrunner
- Swinhoe's White-eye
- White-tailed Kite
- Cassin's Kingbird
- Say's Phoebe
- Blue-gray Gnatcatcher
Nearby spots
- San Joaquin Freshwater Marsh Reserve (southwest) (2.4 km)
- William R Mason Regional Park (2.4 km)
- San Joaquin Freshwater Marsh Reserve (2.7 km)
- Upper Newport Bay Nature Preserve (3.9 km)
- South-Quail Hill Open Space Preserve (5.8 km)
- Crystal Cove (6.5 km)
Frequency is the share of complete checklists at this location that listed the bird, 2016–2025. Busy places report more of everything, and the weekly chart counts species on at least 5% of checklists so a few stray reports do not inflate it. How to read it.