Birding spot · Sarasota County, Florida
Birding at Celery Fields: What You'll See Each Week In November, the birds most often reported at Celery Fields are Palm Warbler (86%), Boat-tailed Grackle (85%), and Red-winged Blackbird (84%). It is busiest in winter, when 87 species turn up on at least 1 in 20 checklists, and species counts peak in mid October (92 species). 243 species have been reported here across 14,790 complete checklists from 3,662 birders.
Species by week 0 20 40 60 80 100 Jan 1-7: 86 species on 5%+ of 645 checklists Jan 8-14: 86 species on 5%+ of 564 checklists Jan 15-21: 85 species on 5%+ of 652 checklists Jan 22-31: 86 species on 5%+ of 813 checklists Feb 1-7: 83 species on 5%+ of 602 checklists Feb 8-14: 90 species on 5%+ of 537 checklists Feb 15-21: 85 species on 5%+ of 610 checklists Feb 22-28: 87 species on 5%+ of 705 checklists Mar 1-7: 85 species on 5%+ of 566 checklists Mar 8-14: 87 species on 5%+ of 523 checklists Mar 15-21: 83 species on 5%+ of 503 checklists Mar 22-31: 86 species on 5%+ of 672 checklists Apr 1-7: 84 species on 5%+ of 354 checklists Apr 8-14: 81 species on 5%+ of 386 checklists Apr 15-21: 77 species on 5%+ of 422 checklists Apr 22-30: 77 species on 5%+ of 426 checklists May 1-7: 69 species on 5%+ of 182 checklists May 8-14: 64 species on 5%+ of 208 checklists May 15-21: 69 species on 5%+ of 110 checklists May 22-31: 62 species on 5%+ of 169 checklists Jun 1-7: 62 species on 5%+ of 109 checklists Jun 8-14: 58 species on 5%+ of 69 checklists Jun 15-21: 59 species on 5%+ of 101 checklists Jun 22-30: 64 species on 5%+ of 100 checklists Jul 1-7: 58 species on 5%+ of 70 checklists Jul 8-14: 58 species on 5%+ of 74 checklists Jul 15-21: 56 species on 5%+ of 75 checklists Jul 22-31: 55 species on 5%+ of 99 checklists Aug 1-7: 55 species on 5%+ of 71 checklists Aug 8-14: 64 species on 5%+ of 57 checklists Aug 15-21: 62 species on 5%+ of 54 checklists Aug 22-31: 59 species on 5%+ of 74 checklists Sep 1-7: 56 species on 5%+ of 54 checklists Sep 8-14: 62 species on 5%+ of 51 checklists Sep 15-21: 61 species on 5%+ of 56 checklists Sep 22-30: 71 species on 5%+ of 72 checklists Oct 1-7: 71 species on 5%+ of 75 checklists Oct 8-14: 73 species on 5%+ of 155 checklists Oct 15-21: 92 species on 5%+ of 184 checklists Oct 22-31: 87 species on 5%+ of 269 checklists Nov 1-7: 79 species on 5%+ of 314 checklists Nov 8-14: 74 species on 5%+ of 320 checklists Nov 15-21: 77 species on 5%+ of 358 checklists Nov 22-30: 75 species on 5%+ of 481 checklists Dec 1-7: 81 species on 5%+ of 357 checklists Dec 8-14: 87 species on 5%+ of 443 checklists Dec 15-21: 87 species on 5%+ of 296 checklists Dec 22-31: 84 species on 5%+ of 703 checklists Jan Feb Mar Apr May Jun Jul Aug Sep Oct Nov Dec Number of species reported on at least 5% of complete checklists, by week (4 per month). Grey bars: fewer than 10 checklists, not counted. In November: what to expect 1 Palm Warbler 86% 2 Boat-tailed Grackle 85% 3 Red-winged Blackbird 84% 4 Common Gallinule 82% 5 Great Egret 78% 6 Little Blue Heron 77% 7 Glossy Ibis 77% 8 Tricolored Heron 77% 9 White Ibis 76% 10 Anhinga 73% 11 Great Blue Heron 71% 12 Blue-gray Gnatcatcher 69% 13 Osprey 68% 14 Mourning Dove 66% 15 Northern Mockingbird 63% Share of complete checklists at this spot that reported the bird in November. The sparkline is the whole year, with this month highlighted.
Season by season Specialties Birds reported far more often here than across Florida.
Nearby spots Frequency is the share of complete checklists at this location that listed the bird, 2016–2025. Busy places report more of everything, and the weekly chart counts species on at least 5% of checklists so a few stray reports do not inflate it. How to read it .
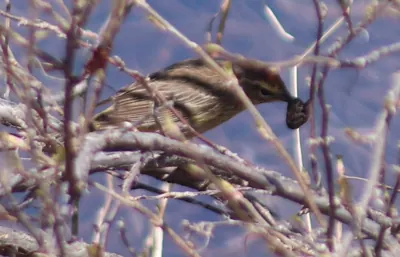 Palm Warbler86%
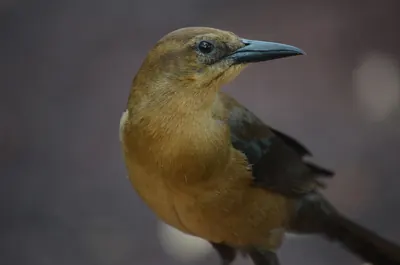 Boat-tailed Grackle85%
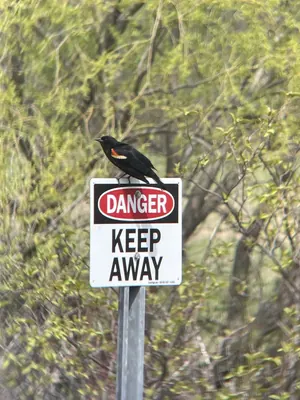 Red-winged Blackbird84%
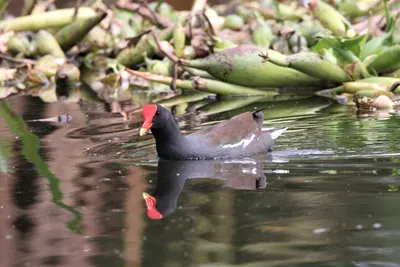 Common Gallinule82%
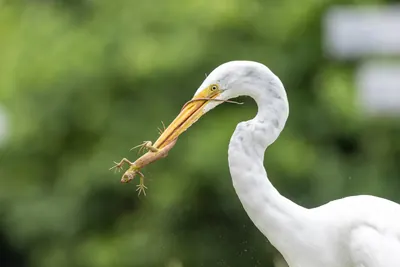 Great Egret78%
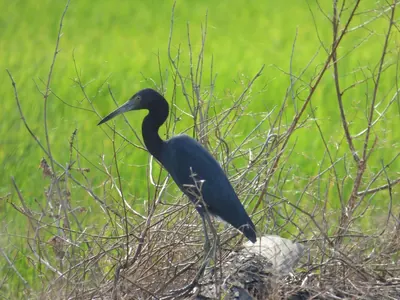 Little Blue Heron77%
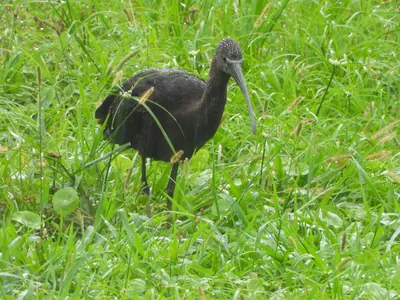 Glossy Ibis77%
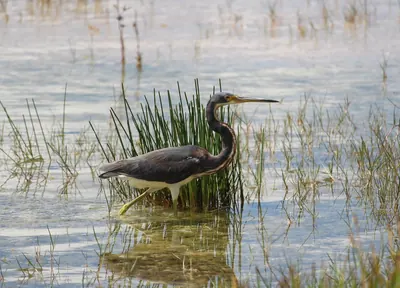 Tricolored Heron77%
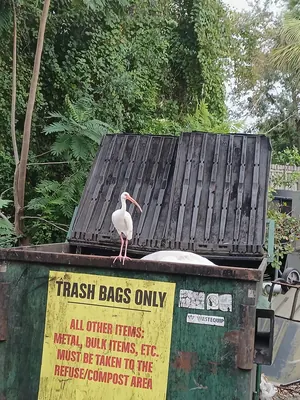 White Ibis76%
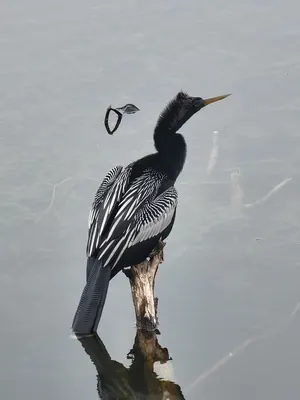 Anhinga73%
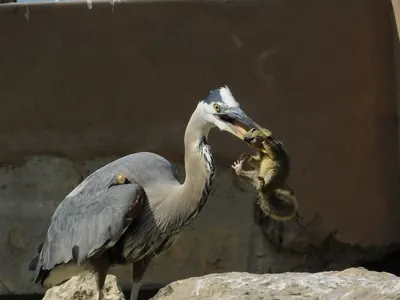 Great Blue Heron71%
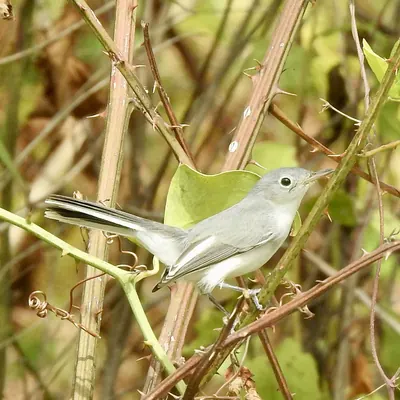 Blue-gray Gnatcatcher69%
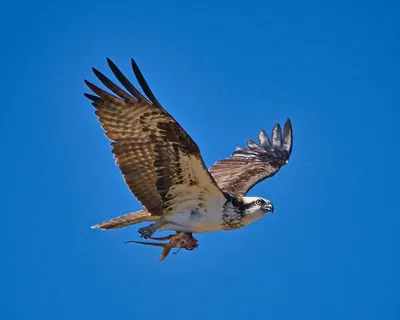 Osprey68%
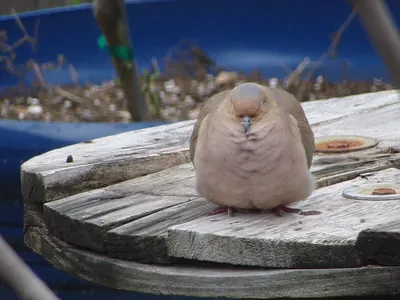 Mourning Dove66%
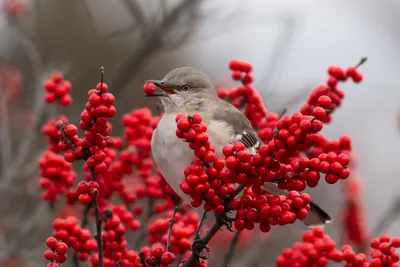 Northern Mockingbird63%