Birding spot · Miami-Dade County, Florida
Birding at Everglades National Park (west): What You'll See Each Week
In November, the birds most often reported at Everglades National Park (west) are Little Blue Heron (79%), Great Egret (77%), and American Coot (74%). It is busiest in fall, when 80 species turn up on at least 1 in 20 checklists, and species counts peak in the second week of December (81 species). 175 species have been reported here across 1,212 complete checklists from 571 birders.
Species by week
In November: what to expect
- 1
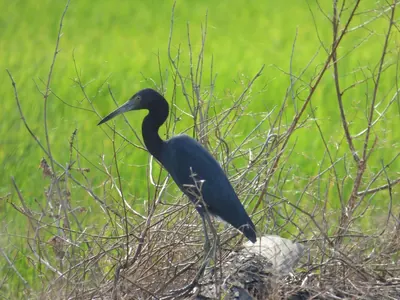 Little Blue Heron79%
- 2
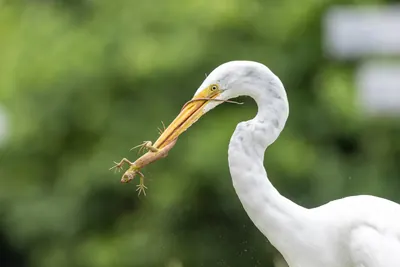 Great Egret77%
- 3
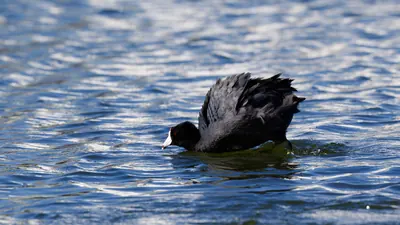 American Coot74%
- 4
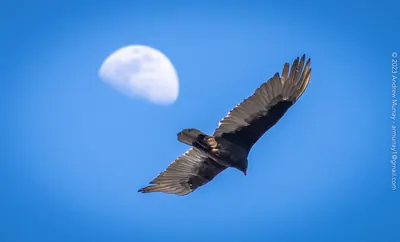 Turkey Vulture68%
- 5
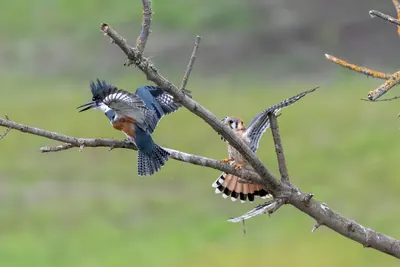 Belted Kingfisher62%
- 6
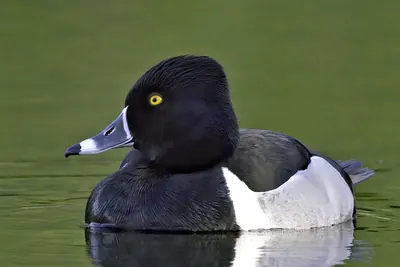 Ring-necked Duck59%
- 7
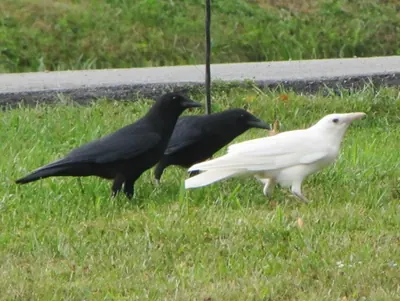 American Crow58%
- 8
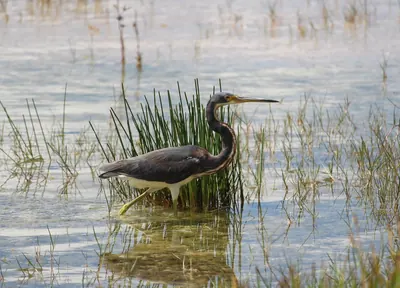 Tricolored Heron57%
- 9
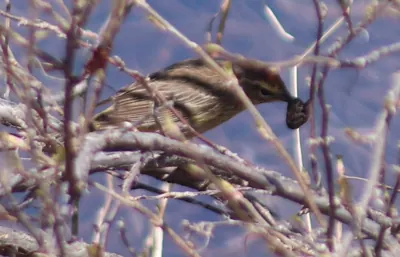 Palm Warbler54%
- 10
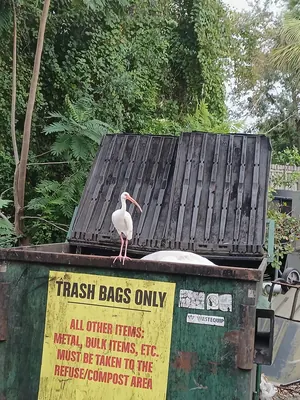 White Ibis54%
- 11
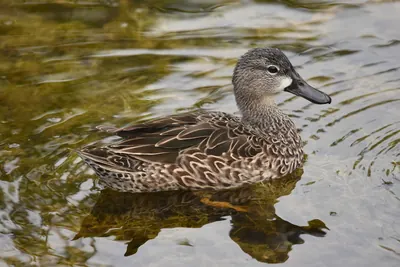 Blue-winged Teal53%
- 12
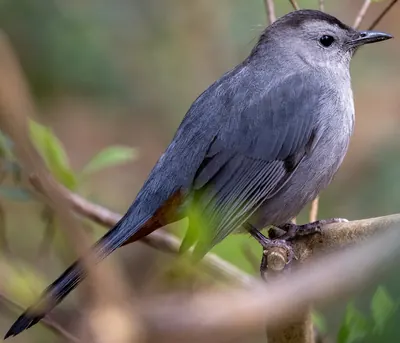 Gray Catbird52%
- 13
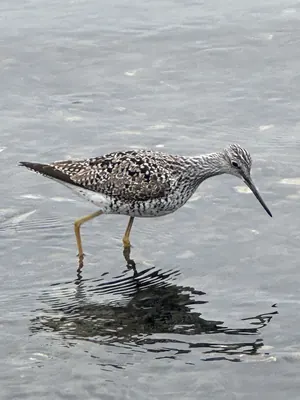 Greater Yellowlegs51%
- 14
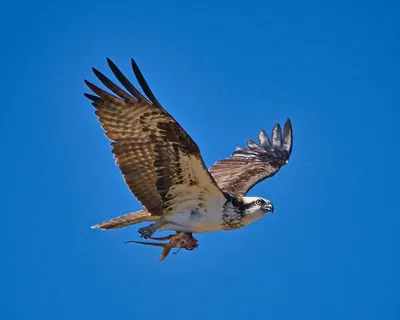 Osprey49%
- 15
 Eastern Phoebe46%
Share of complete checklists at this spot that reported the bird in November. The sparkline is the whole year, with this month highlighted.
Season by season
Winter 64 species
Spring 71 species
Summer 61 species
Fall 80 species
Specialties
Birds reported far more often here than across Florida.
- La Sagra's Flycatcher
- Brown-crested Flycatcher
- Northern Pintail
- Black-throated Green Warbler
- Ruddy Duck
- Long-billed Dowitcher
- American Wigeon
- Ring-necked Duck
Nearby spots
- Everglades National Park (west) (1.2 km)
- Everglades National Park (1.5 km)
- Everglades National Park (west) (3.7 km)
- Parachute Key (4.0 km)
- Frog Pond/L-31 N Transition Lands (west) (5.2 km)
- Frog Pond/L-31 N Transition Lands (5.7 km)
Frequency is the share of complete checklists at this location that listed the bird, 2016–2025. Busy places report more of everything, and the weekly chart counts species on at least 5% of checklists so a few stray reports do not inflate it. How to read it.