Birding spot · Lee County, Florida
Birding at J. N. Ding Darling National Wildlife Refuge.closing Order Boundary: What You'll See Each Week
In November, the birds most often reported at J. N. Ding Darling National Wildlife Refuge.closing Order Boundary are Brown Pelican (89%), Sanderling (89%), and Black-bellied Plover (80%). It is busiest in fall, when 38 species turn up on at least 1 in 20 checklists, and species counts peak in late October (56 species). 103 species have been reported here across 828 complete checklists from 337 birders.
Species by week
In November: what to expect
- 1
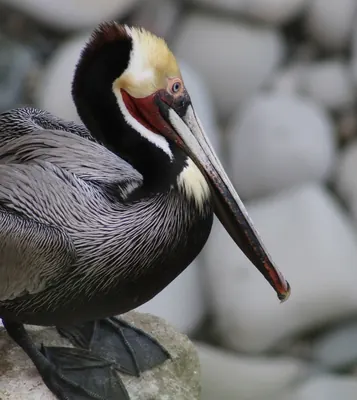 Brown Pelican89%
- 2
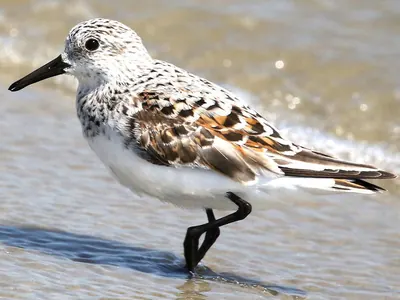 Sanderling89%
- 3
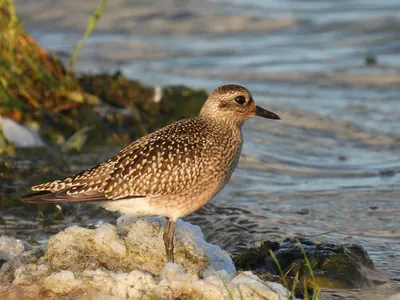 Black-bellied Plover80%
- 4
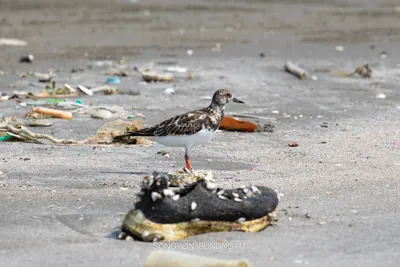 Ruddy Turnstone78%
- 5
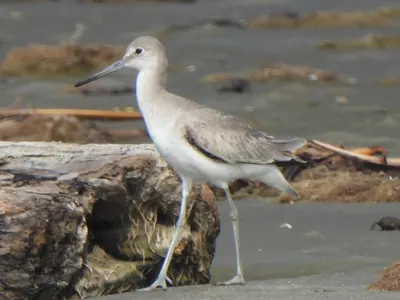 Willet78%
- 6
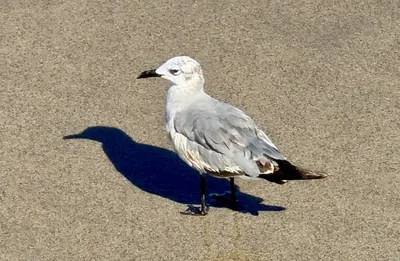 Laughing Gull64%
- 7
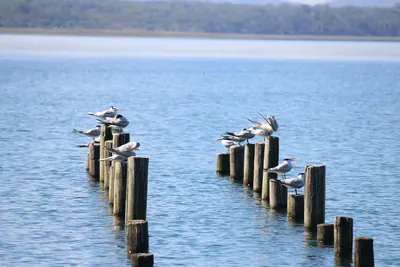 Royal Tern53%
- 8
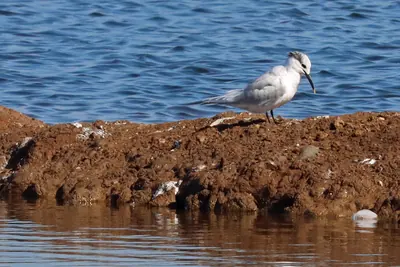 Sandwich Tern50%
- 9
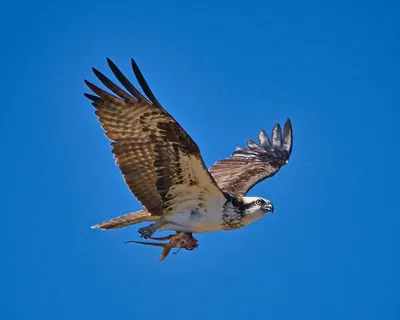 Osprey45%
- 10
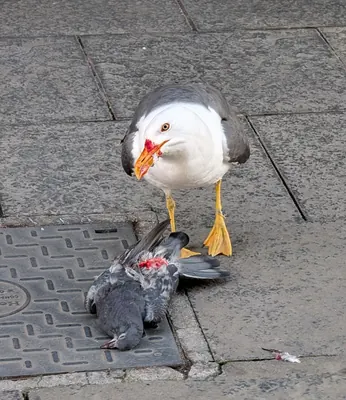 Lesser Black-backed Gull42%
- 11
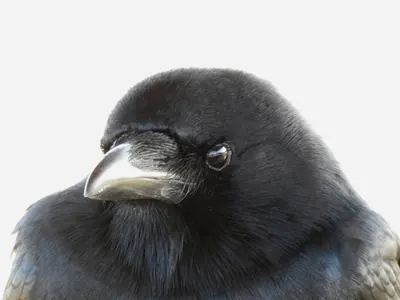 Fish Crow31%
- 12
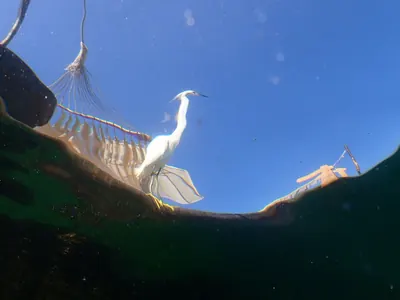 Snowy Egret31%
- 13
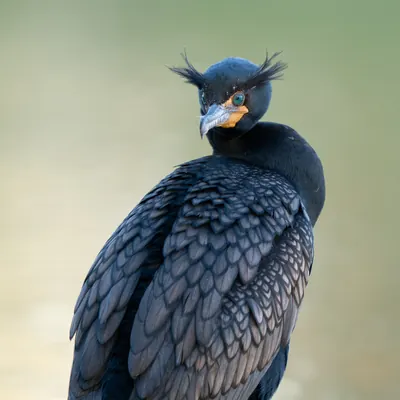 Double-crested Cormorant30%
- 14
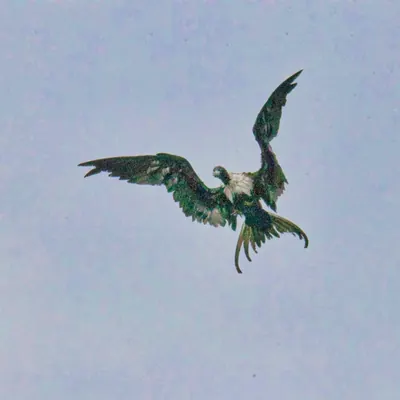 Magnificent Frigatebird25%
- 15
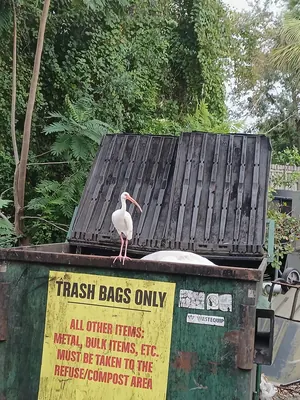 White Ibis23%
Share of complete checklists at this spot that reported the bird in November. The sparkline is the whole year, with this month highlighted.
Season by season
Winter 32 species
Spring 34 species
- Brown Pelican78%
- Ruddy Turnstone73%
- Sanderling71%
- Fish Crow68%
- Willet64%
Summer 29 species
- Brown Pelican82%
- Laughing Gull77%
- Fish Crow65%
- White Ibis64%
- Osprey58%
Fall 38 species
Specialties
Birds reported far more often here than across Florida.
- Snowy Plover
- Lesser Black-backed Gull
- Black-bellied Plover
- Red Knot
- Ruddy Turnstone
- Sanderling
- Sandwich Tern
- Willet
Nearby spots
- J. N. Ding Darling National Wildlife Refuge (0.6 km)
- J. N. Ding Darling National Wildlife Refuge (northwest) (4.2 km)
- Pond Apple Park (4.9 km)
- Sanibel Bayou (5.0 km)
- J. N. Ding Darling National Wildlife Refuge (Sanibel Bayou) (5.4 km)
- Lighthouse Beach Park (7.3 km)
Frequency is the share of complete checklists at this location that listed the bird, 2016–2025. Busy places report more of everything, and the weekly chart counts species on at least 5% of checklists so a few stray reports do not inflate it. How to read it.