Birding spot · Lee County, Florida
Birding at J. N. Ding Darling National Wildlife Refuge: What You'll See Each Week
In November, the birds most often reported at J. N. Ding Darling National Wildlife Refuge are Little Blue Heron (79%), Tricolored Heron (74%), and Palm Warbler (71%). It is busiest in spring, when 60 species turn up on at least 1 in 20 checklists, and species counts peak in the second week of October (72 species). 188 species have been reported here across 3,251 complete checklists from 1,185 birders.
Species by week
In November: what to expect
- 1
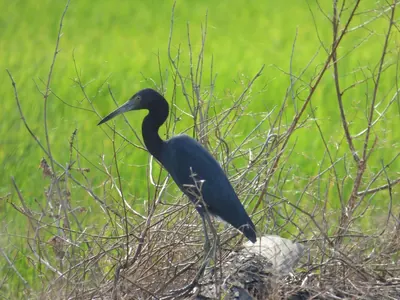 Little Blue Heron79%
- 2
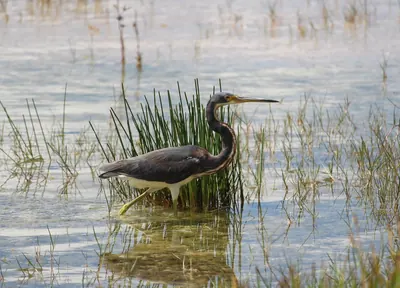 Tricolored Heron74%
- 3
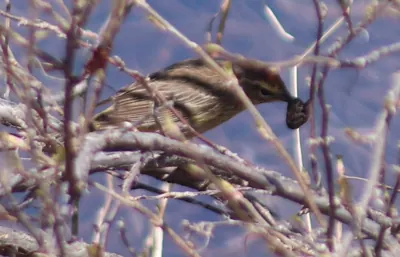 Palm Warbler71%
- 4
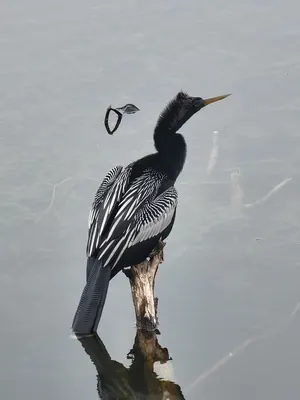 Anhinga71%
- 5
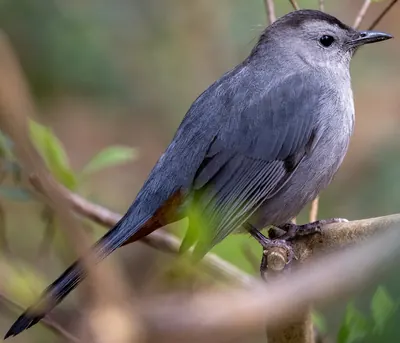 Gray Catbird71%
- 6
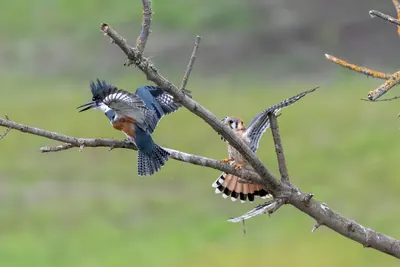 Belted Kingfisher68%
- 7
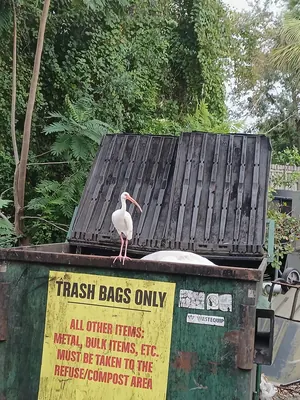 White Ibis66%
- 8
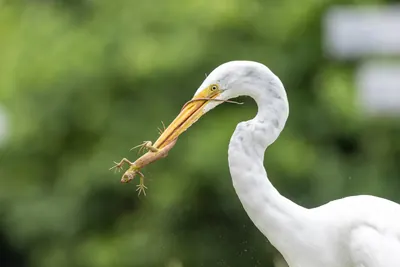 Great Egret63%
- 9
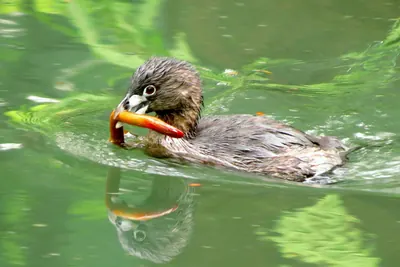 Pied-billed Grebe63%
- 10
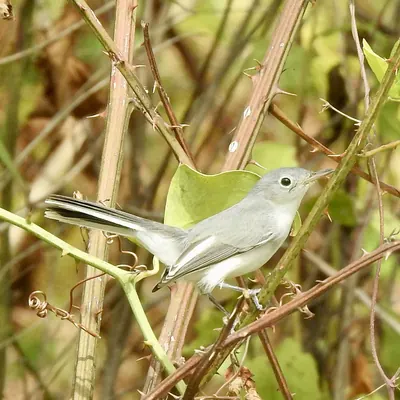 Blue-gray Gnatcatcher55%
- 11
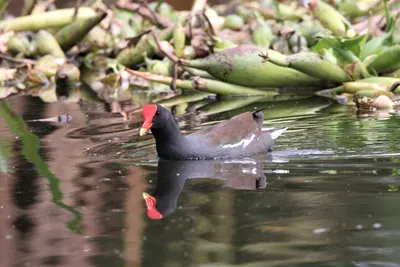 Common Gallinule53%
- 12
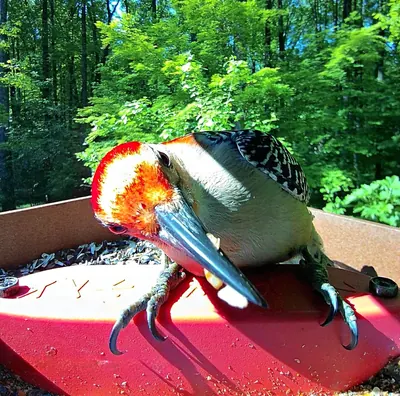 Red-bellied Woodpecker53%
- 13
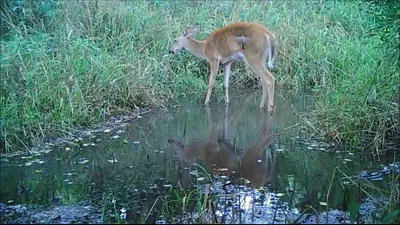 Eastern Phoebe49%
- 14
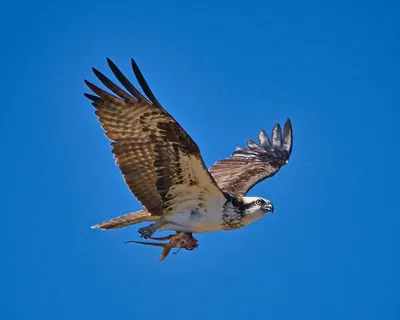 Osprey46%
- 15
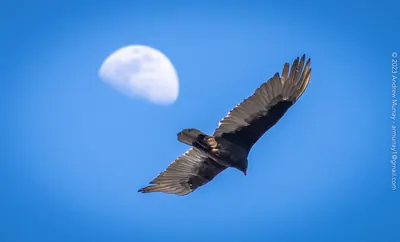 Turkey Vulture45%
Share of complete checklists at this spot that reported the bird in November. The sparkline is the whole year, with this month highlighted.
Season by season
Winter 52 species
Spring 60 species
Summer 42 species
Fall 60 species
Specialties
Birds reported far more often here than across Florida.
- Black-necked Stilt
- Blue-winged Teal
- Mottled Duck
- Pied-billed Grebe
- Killdeer
- Sora
- Tricolored Heron
- Green Heron
Nearby spots
- J. N. Ding Darling National Wildlife Refuge.closing Order Boundary (0.6 km)
- J. N. Ding Darling National Wildlife Refuge (northwest) (3.7 km)
- Sanibel Bayou (4.4 km)
- Pond Apple Park (4.7 km)
- J. N. Ding Darling National Wildlife Refuge (Sanibel Bayou) (4.9 km)
- Lighthouse Beach Park (7.2 km)
Frequency is the share of complete checklists at this location that listed the bird, 2016–2025. Busy places report more of everything, and the weekly chart counts species on at least 5% of checklists so a few stray reports do not inflate it. How to read it.