Birding spot · Brevard County, Florida
Birding at Lori Wilson Park: What You'll See Each Week
In November, the birds most often reported at Lori Wilson Park are Brown Pelican (83%), Laughing Gull (81%), and Sanderling (70%). It is busiest in spring, when 50 species turn up on at least 1 in 20 checklists, and species counts peak in early January (54 species). 135 species have been reported here across 1,023 complete checklists from 405 birders.
Species by week
In November: what to expect
- 1
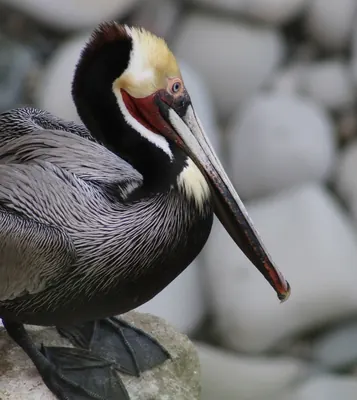 Brown Pelican83%
- 2
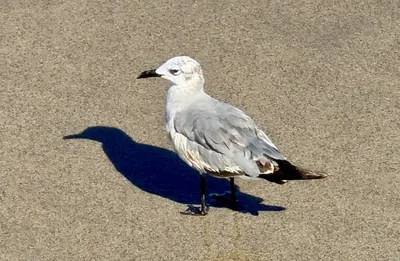 Laughing Gull81%
- 3
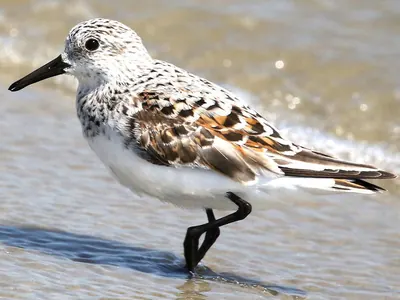 Sanderling70%
- 4
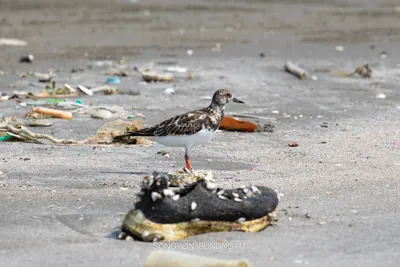 Ruddy Turnstone62%
- 5
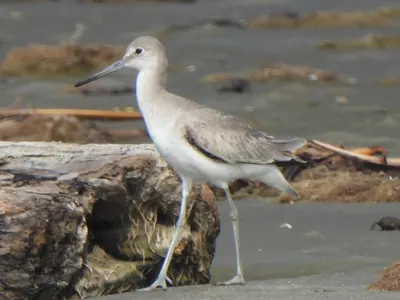 Willet57%
- 6
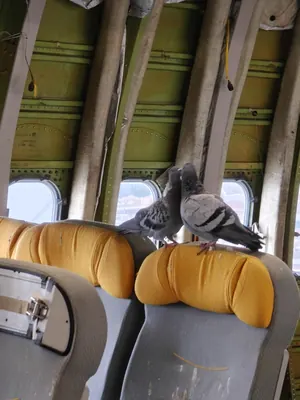 Rock Pigeon55%
- 7
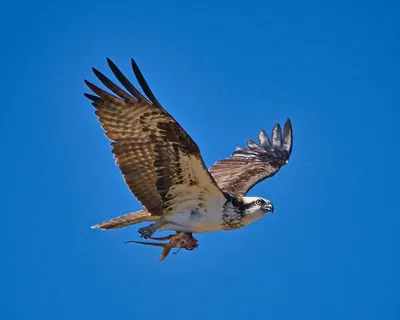 Osprey53%
- 8
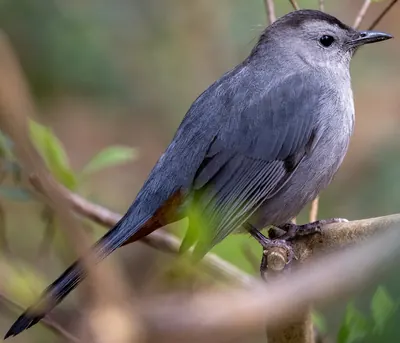 Gray Catbird51%
- 9
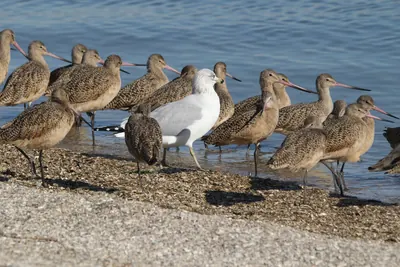 Ring-billed Gull51%
- 10
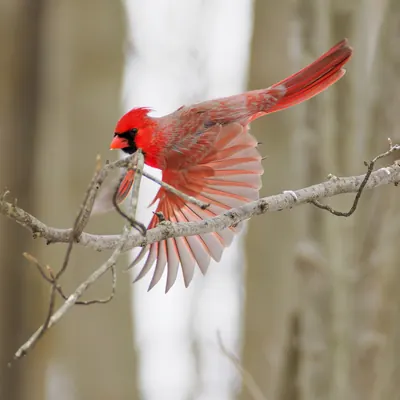 Northern Cardinal49%
- 11
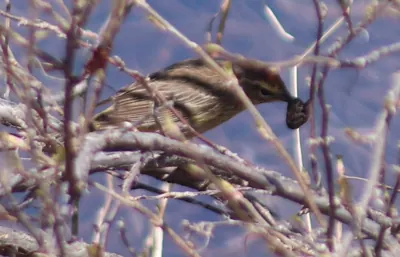 Palm Warbler42%
- 12
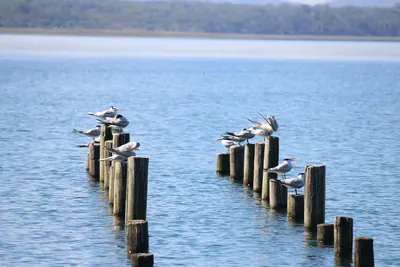 Royal Tern42%
- 13
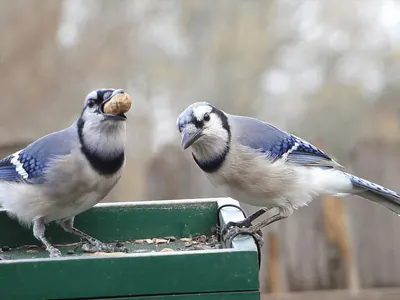 Blue Jay38%
- 14
 Yellow-rumped Warbler36%
- 15
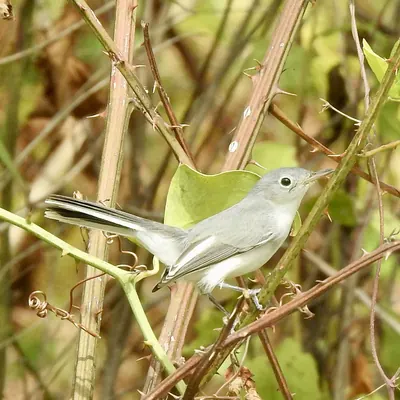 Blue-gray Gnatcatcher34%
Share of complete checklists at this spot that reported the bird in November. The sparkline is the whole year, with this month highlighted.
Season by season
Winter 44 species
Spring 50 species
Summer 31 species
Fall 47 species
- Brown Pelican71%
- Laughing Gull69%
- Northern Cardinal65%
- Sanderling59%
- Osprey53%
Specialties
Birds reported far more often here than across Florida.
- Blackpoll Warbler
- Cape May Warbler
- Painted Bunting
- Worm-eating Warbler
- Black-throated Blue Warbler
- Northern Gannet
- Rock Pigeon
- Ovenbird
Nearby spots
- Cocoa Beach Maritime Hammock Preserve (0.6 km)
- Rotary Park-Merritt Island (7.6 km)
- Jetty Park (7.9 km)
- Helen and Allan Cruickshank Sanctuary (10.8 km)
- River Lakes Conservation Area (23.1 km)
- Canaveral Marshes Conservation Area (26.2 km)
Frequency is the share of complete checklists at this location that listed the bird, 2016–2025. Busy places report more of everything, and the weekly chart counts species on at least 5% of checklists so a few stray reports do not inflate it. How to read it.