Birding spot · Alachua County, Florida
Birding at Paynes Prairie Preserve State Park: What You'll See Each Week In November, the birds most often reported at Paynes Prairie Preserve State Park are Common Gallinule (96%), Great Blue Heron (96%), and Anhinga (94%). It is busiest in winter, when 100 species turn up on at least 1 in 20 checklists, and species counts peak in mid December (104 species). 239 species have been reported here across 12,716 complete checklists from 3,264 birders.
Species by week 0 25 50 75 100 125 Jan 1-7: 102 species on 5%+ of 533 checklists Jan 8-14: 101 species on 5%+ of 398 checklists Jan 15-21: 97 species on 5%+ of 387 checklists Jan 22-31: 98 species on 5%+ of 445 checklists Feb 1-7: 98 species on 5%+ of 383 checklists Feb 8-14: 96 species on 5%+ of 387 checklists Feb 15-21: 93 species on 5%+ of 395 checklists Feb 22-28: 94 species on 5%+ of 408 checklists Mar 1-7: 93 species on 5%+ of 326 checklists Mar 8-14: 96 species on 5%+ of 311 checklists Mar 15-21: 90 species on 5%+ of 311 checklists Mar 22-31: 99 species on 5%+ of 411 checklists Apr 1-7: 95 species on 5%+ of 280 checklists Apr 8-14: 95 species on 5%+ of 306 checklists Apr 15-21: 92 species on 5%+ of 401 checklists Apr 22-30: 90 species on 5%+ of 434 checklists May 1-7: 87 species on 5%+ of 278 checklists May 8-14: 78 species on 5%+ of 271 checklists May 15-21: 69 species on 5%+ of 167 checklists May 22-31: 69 species on 5%+ of 242 checklists Jun 1-7: 65 species on 5%+ of 289 checklists Jun 8-14: 65 species on 5%+ of 193 checklists Jun 15-21: 63 species on 5%+ of 183 checklists Jun 22-30: 63 species on 5%+ of 157 checklists Jul 1-7: 56 species on 5%+ of 105 checklists Jul 8-14: 60 species on 5%+ of 98 checklists Jul 15-21: 63 species on 5%+ of 111 checklists Jul 22-31: 61 species on 5%+ of 166 checklists Aug 1-7: 63 species on 5%+ of 81 checklists Aug 8-14: 64 species on 5%+ of 113 checklists Aug 15-21: 72 species on 5%+ of 117 checklists Aug 22-31: 66 species on 5%+ of 116 checklists Sep 1-7: 69 species on 5%+ of 127 checklists Sep 8-14: 78 species on 5%+ of 109 checklists Sep 15-21: 75 species on 5%+ of 145 checklists Sep 22-30: 83 species on 5%+ of 180 checklists Oct 1-7: 90 species on 5%+ of 140 checklists Oct 8-14: 90 species on 5%+ of 181 checklists Oct 15-21: 89 species on 5%+ of 186 checklists Oct 22-31: 96 species on 5%+ of 392 checklists Nov 1-7: 95 species on 5%+ of 244 checklists Nov 8-14: 89 species on 5%+ of 258 checklists Nov 15-21: 93 species on 5%+ of 296 checklists Nov 22-30: 88 species on 5%+ of 430 checklists Dec 1-7: 98 species on 5%+ of 216 checklists Dec 8-14: 95 species on 5%+ of 242 checklists Dec 15-21: 104 species on 5%+ of 300 checklists Dec 22-31: 92 species on 5%+ of 467 checklists Jan Feb Mar Apr May Jun Jul Aug Sep Oct Nov Dec Number of species reported on at least 5% of complete checklists, by week (4 per month). Grey bars: fewer than 10 checklists, not counted. In November: what to expect 1 Common Gallinule 96% 2 Great Blue Heron 96% 3 Anhinga 94% 4 Little Blue Heron 92% 5 Great Egret 92% 6 American Coot 90% 7 Palm Warbler 89% 8 Red-winged Blackbird 88% 9 Eastern Phoebe 88% 10 White Ibis 87% 11 Tricolored Heron 87% 12 Double-crested Cormorant 83% 13 Snowy Egret 81% 14 Blue-winged Teal 74% 15 Pied-billed Grebe 74% Share of complete checklists at this spot that reported the bird in November. The sparkline is the whole year, with this month highlighted.
Season by season Specialties Birds reported far more often here than across Florida.
King Rail 12% of checklists here vs 0.4% statewide: 29.1× American Bittern 20% of checklists here vs 0.7% statewide: 28.7× Virginia Rail 5.9% of checklists here vs 0.2% statewide: 27.0× Sora 32% of checklists here vs 1.3% statewide: 24.5× Snail Kite 26% of checklists here vs 1.1% statewide: 23.1× Marsh Wren 28% of checklists here vs 1.4% statewide: 19.8× Least Bittern 23% of checklists here vs 1.2% statewide: 19.4× Bobolink 7.4% of checklists here vs 0.4% statewide: 17.1× Nearby spots Frequency is the share of complete checklists at this location that listed the bird, 2016–2025. Busy places report more of everything, and the weekly chart counts species on at least 5% of checklists so a few stray reports do not inflate it. How to read it .
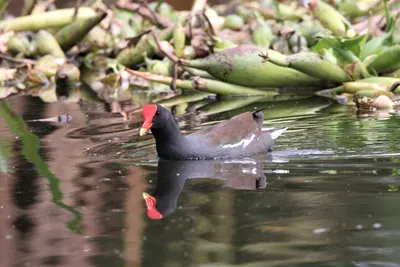 Common Gallinule96%
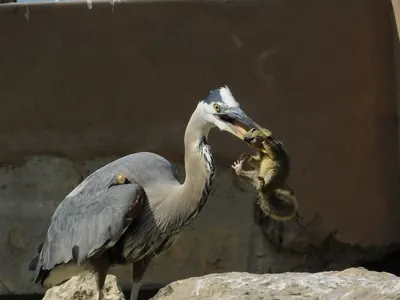 Great Blue Heron96%
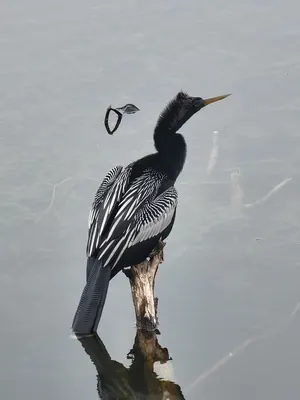 Anhinga94%
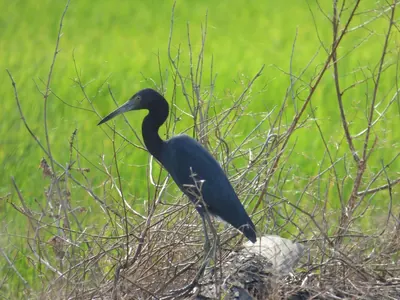 Little Blue Heron92%
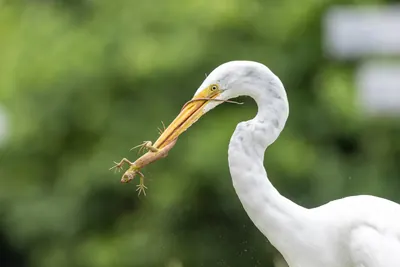 Great Egret92%
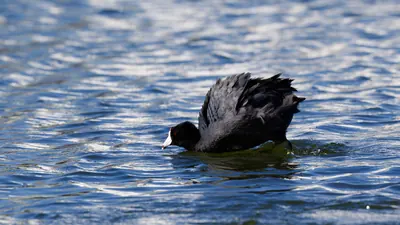 American Coot90%
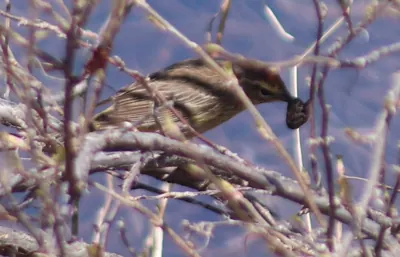 Palm Warbler89%
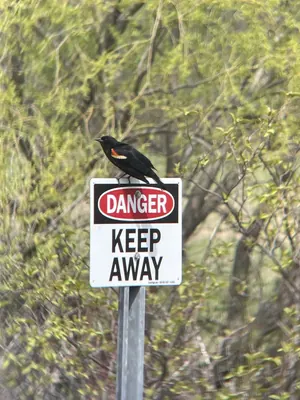 Red-winged Blackbird88%
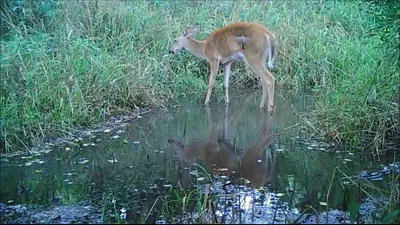 Eastern Phoebe88%
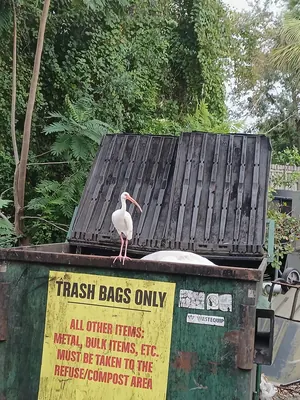 White Ibis87%
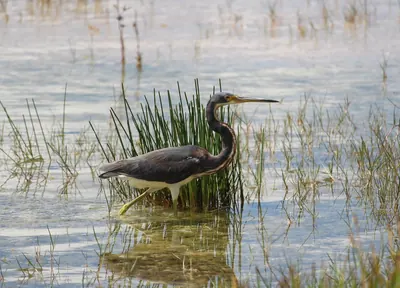 Tricolored Heron87%
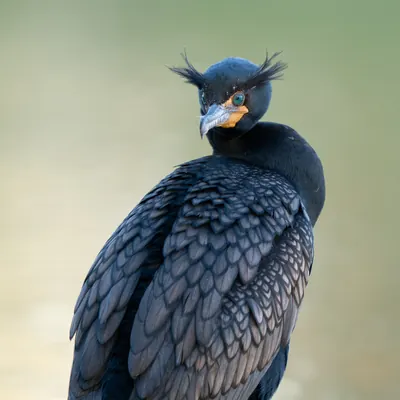 Double-crested Cormorant83%
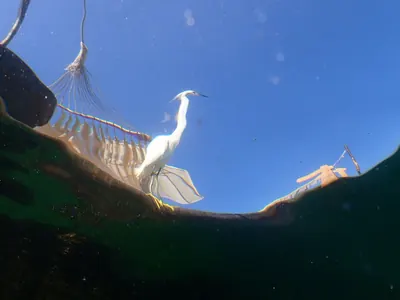 Snowy Egret81%
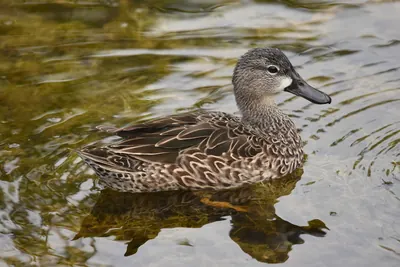 Blue-winged Teal74%
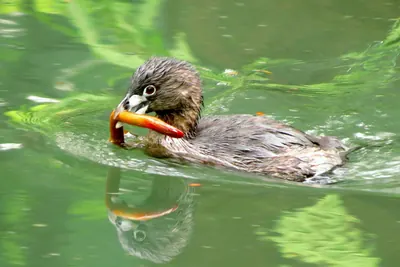 Pied-billed Grebe74%