Birding spot · Alachua County, Florida
Birding at Boulware Springs Park: What You'll See Each Week
In November, the birds most often reported at Boulware Springs Park are Eastern Phoebe (91%), Red-headed Woodpecker (90%), and American Crow (84%). It is busiest in fall, when 72 species turn up on at least 1 in 20 checklists, and species counts peak in mid March (77 species). 136 species have been reported here across 826 complete checklists from 341 birders.
Species by week
In November: what to expect
- 1
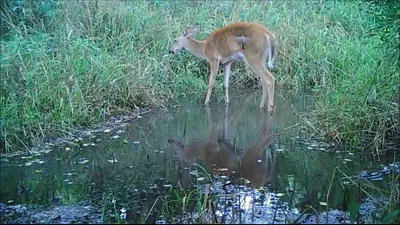 Eastern Phoebe91%
- 2
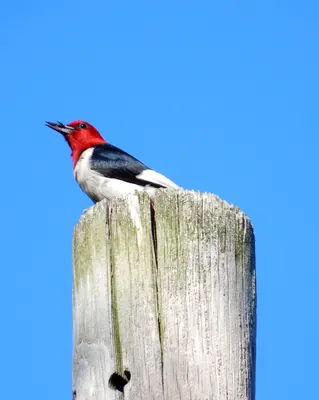 Red-headed Woodpecker90%
- 3
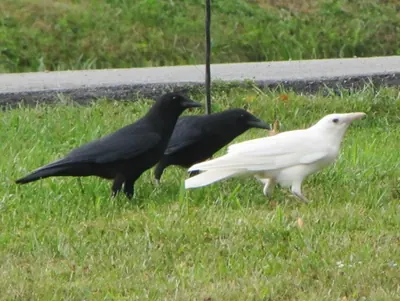 American Crow84%
- 4Northern House Wren81%
- 5
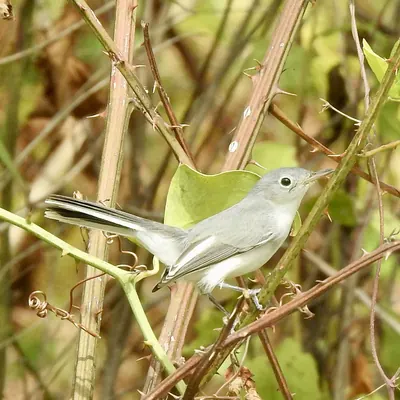 Blue-gray Gnatcatcher79%
- 6
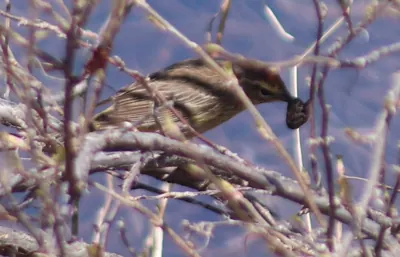 Palm Warbler79%
- 7
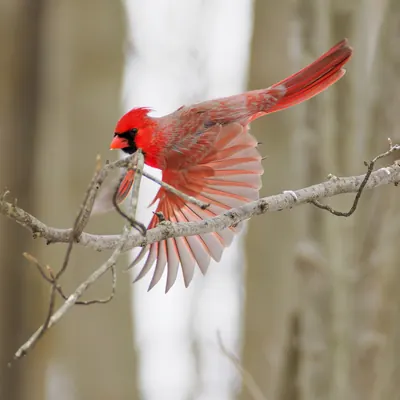 Northern Cardinal78%
- 8
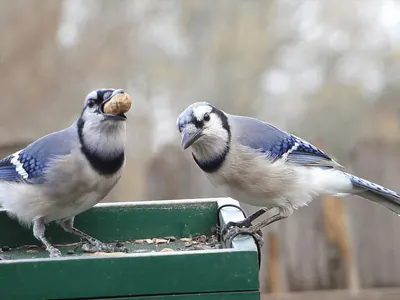 Blue Jay72%
- 9
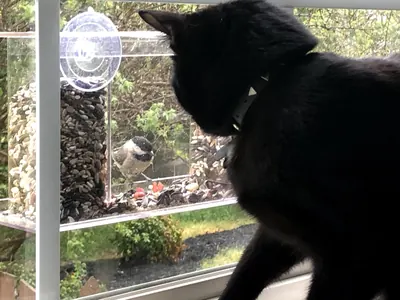 Carolina Chickadee72%
- 10
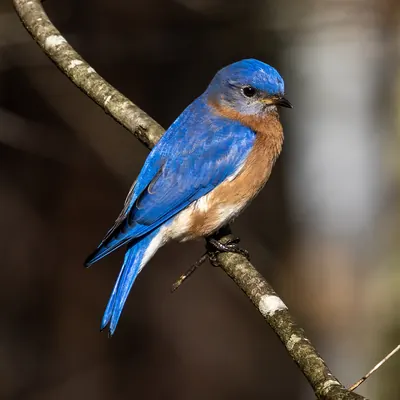 Eastern Bluebird72%
- 11
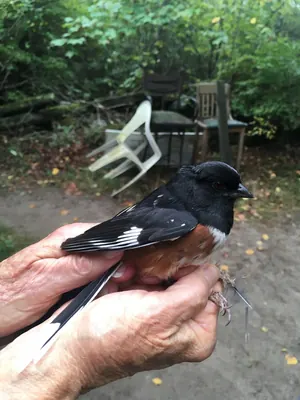 Eastern Towhee72%
- 12
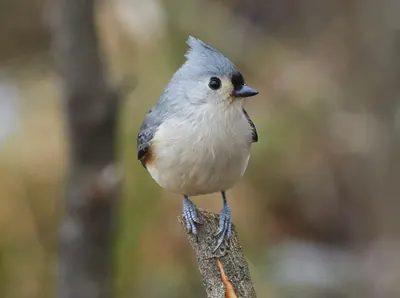 Tufted Titmouse72%
- 13
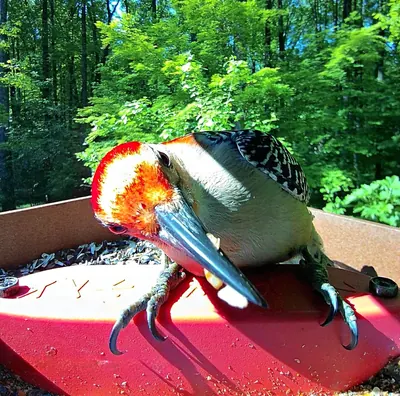 Red-bellied Woodpecker70%
- 14
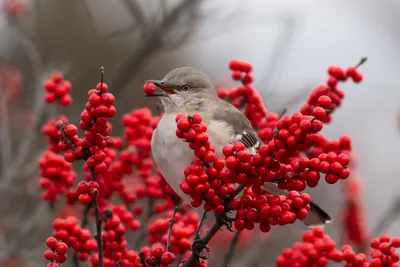 Northern Mockingbird67%
- 15
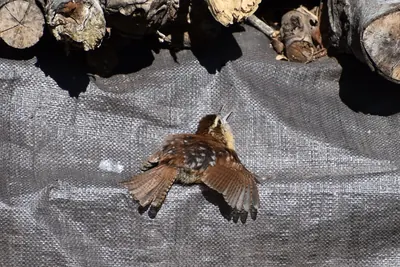 Carolina Wren66%
Share of complete checklists at this spot that reported the bird in November. The sparkline is the whole year, with this month highlighted.
Season by season
Winter 64 species
Spring 69 species
Summer 51 species
Fall 72 species
Specialties
Birds reported far more often here than across Florida.
- Field Sparrow
- Red-headed Woodpecker
- Grasshopper Sparrow
- White-throated Sparrow
- Northern Bobwhite
- Eastern Towhee
- Chipping Sparrow
- Song Sparrow
Nearby spots
- Alachua Rail to Trail (0.8 km)
- Paynes Prairie Preserve State Park (Alachua Sink) (1.7 km)
- Paynes Prairie Preserve State Park (2.0 km)
- Depot Park (2.7 km)
- Earl P. Powers Park (5.5 km)
- Paynes Prairie Preserve State Park (south) (5.9 km)
Frequency is the share of complete checklists at this location that listed the bird, 2016–2025. Busy places report more of everything, and the weekly chart counts species on at least 5% of checklists so a few stray reports do not inflate it. How to read it.