Birding spot · Alachua County, Florida
Birding at Earl P. Powers Park: What You'll See Each Week
In November, the birds most often reported at Earl P. Powers Park are Double-crested Cormorant (90%), Anhinga (85%), and Bald Eagle (85%). It is busiest in spring, when 75 species turn up on at least 1 in 20 checklists, and species counts peak in mid March (76 species). 164 species have been reported here across 1,111 complete checklists from 332 birders.
Species by week
In November: what to expect
- 1
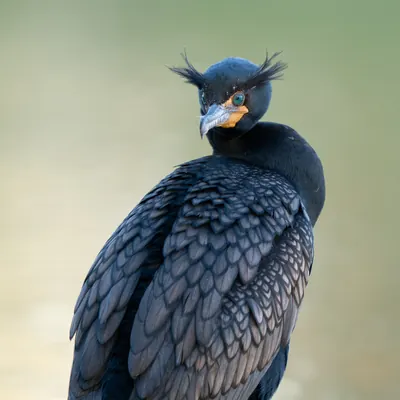 Double-crested Cormorant90%
- 2
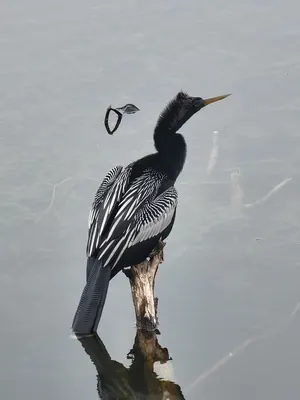 Anhinga85%
- 3
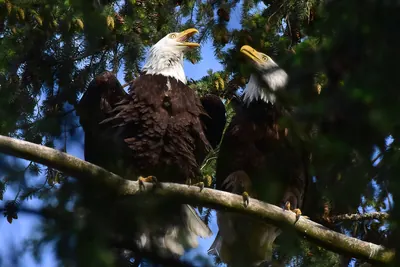 Bald Eagle85%
- 4
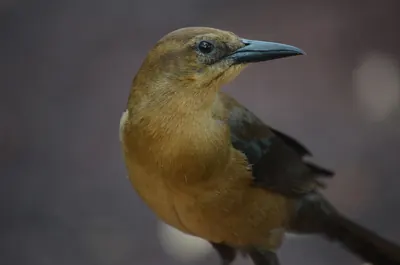 Boat-tailed Grackle77%
- 5
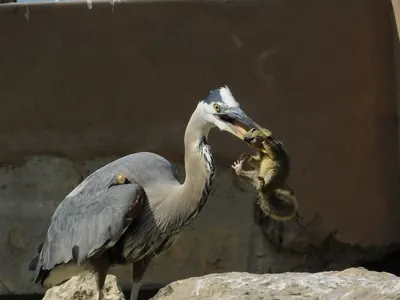 Great Blue Heron77%
- 6
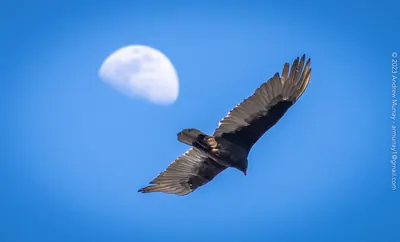 Turkey Vulture77%
- 7
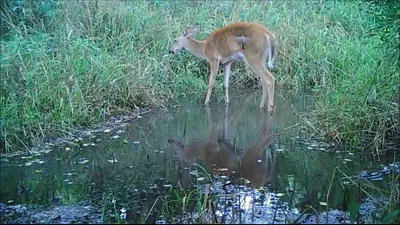 Eastern Phoebe73%
- 8
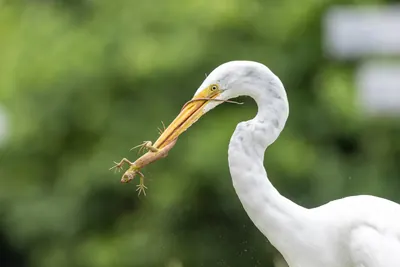 Great Egret66%
- 9
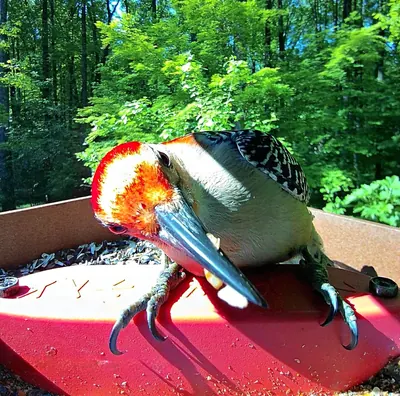 Red-bellied Woodpecker59%
- 10
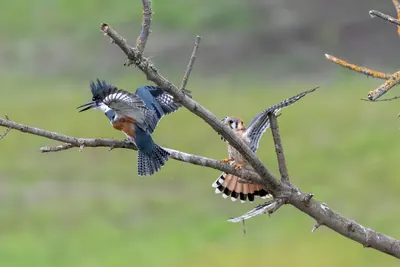 Belted Kingfisher57%
- 11
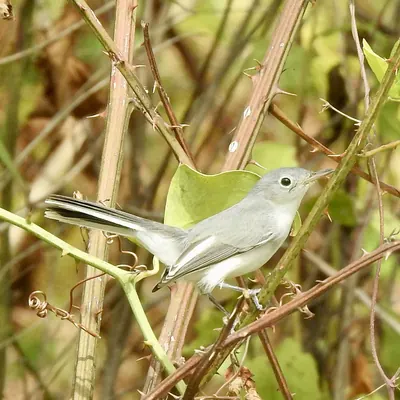 Blue-gray Gnatcatcher51%
- 12
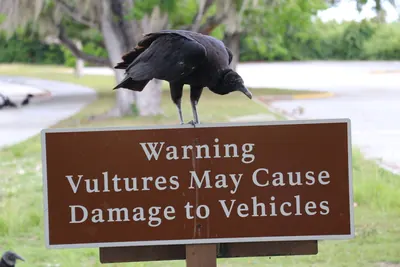 Black Vulture48%
- 13
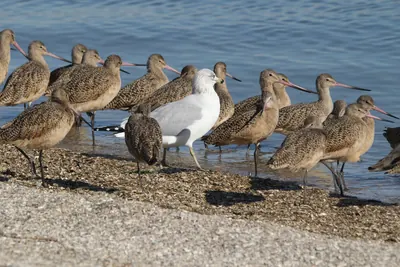 Ring-billed Gull48%
- 14
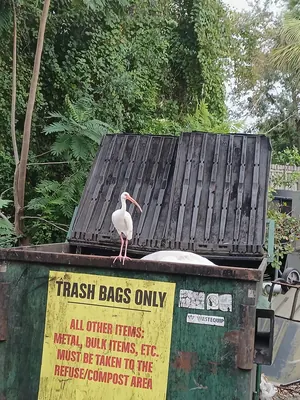 White Ibis45%
- 15
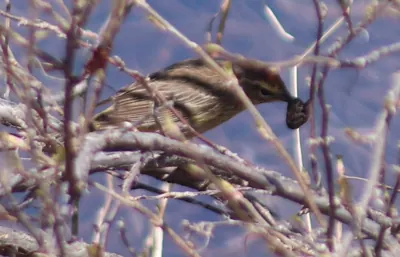 Palm Warbler42%
Share of complete checklists at this spot that reported the bird in November. The sparkline is the whole year, with this month highlighted.
Season by season
Winter 59 species
Spring 75 species
Summer 54 species
- Osprey84%
- Anhinga82%
- Carolina Wren64%
- Turkey Vulture63%
- Black Vulture62%
Fall 68 species
Specialties
Birds reported far more often here than across Florida.
- Prothonotary Warbler
- Bonaparte's Gull
- Bald Eagle
- Short-tailed Hawk
- Northern Yellow Warbler
- Yellow-throated Warbler
- Common Loon
- Summer Tanager
Nearby spots
- Palm Point Nature Park (2.4 km)
- Paynes Prairie Preserve State Park (Alachua Sink) (5.2 km)
- Boulware Springs Park (5.5 km)
- Alachua Rail to Trail (5.9 km)
- Paynes Prairie Preserve State Park (southeast) (6.5 km)
- Depot Park (7.5 km)
Frequency is the share of complete checklists at this location that listed the bird, 2016–2025. Busy places report more of everything, and the weekly chart counts species on at least 5% of checklists so a few stray reports do not inflate it. How to read it.