Birding spot · Alachua County, Florida
Birding at Paynes Prairie Preserve State Park (southeast): What You'll See Each Week
In November, the birds most often reported at Paynes Prairie Preserve State Park (southeast) are Eastern Phoebe (96%), Yellow-rumped Warbler (94%), and Turkey Vulture (93%). It is busiest in spring, when 114 species turn up on at least 1 in 20 checklists, and species counts peak in late March (120 species). 203 species have been reported here across 1,127 complete checklists from 449 birders.
Species by week
In November: what to expect
- 1
 Eastern Phoebe96%
- 2
 Yellow-rumped Warbler94%
- 3
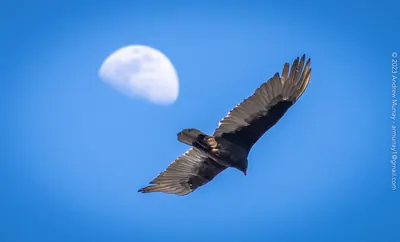 Turkey Vulture93%
- 4
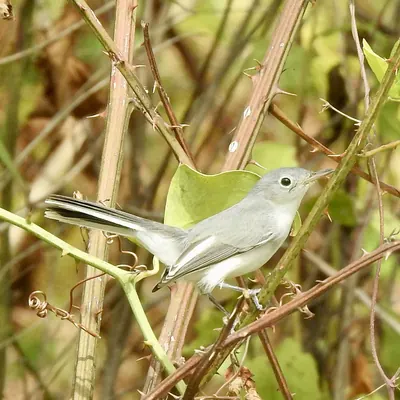 Blue-gray Gnatcatcher89%
- 5
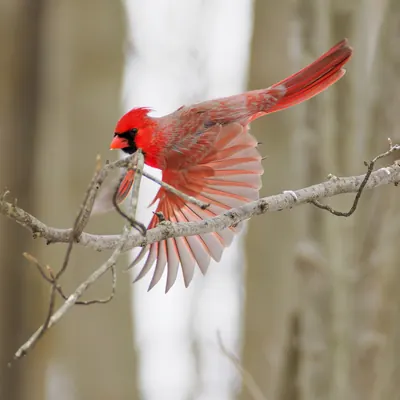 Northern Cardinal89%
- 6Northern House Wren88%
- 7
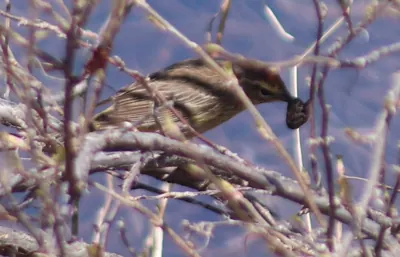 Palm Warbler87%
- 8
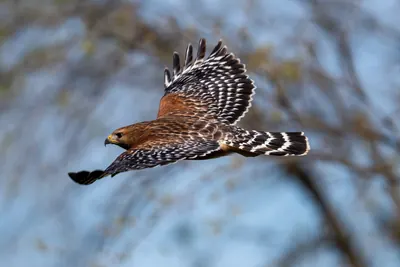 Red-shouldered Hawk85%
- 9
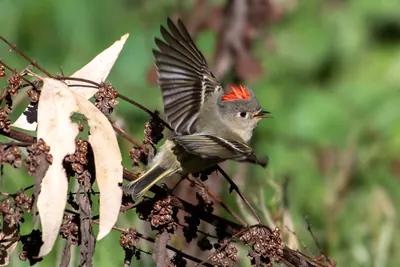 Ruby-crowned Kinglet84%
- 10
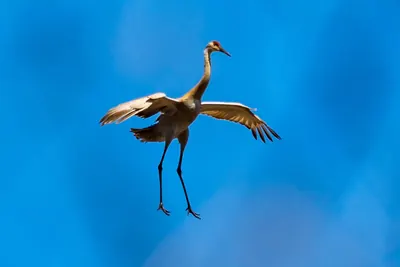 Sandhill Crane84%
- 11
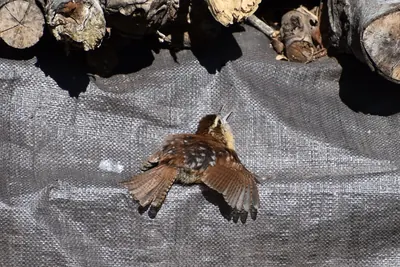 Carolina Wren83%
- 12
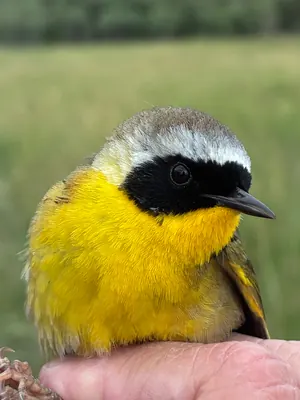 Common Yellowthroat77%
- 13
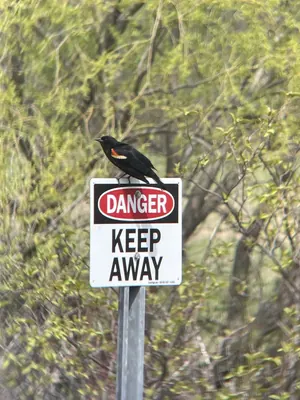 Red-winged Blackbird77%
- 14
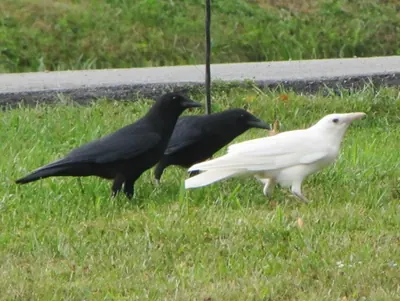 American Crow76%
- 15
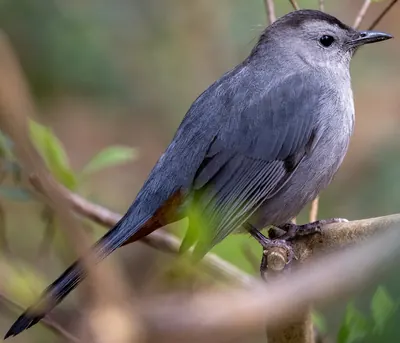 Gray Catbird76%
Share of complete checklists at this spot that reported the bird in November. The sparkline is the whole year, with this month highlighted.
Season by season
Winter 106 species
Spring 114 species
Summer 86 species
Fall 109 species
Specialties
Birds reported far more often here than across Florida.
- White-faced Ibis
- Whooping Crane
- Least Flycatcher
- Northern Pintail
- Gadwall
- Sedge Wren
- Song Sparrow
- Vermilion Flycatcher
Nearby spots
- Chacala Pond (2.1 km)
- Wauberg Lake (4.2 km)
- Paynes Prairie Preserve State Park (south) (4.3 km)
- Paynes Prairie Preserve State Park (Alachua Sink) (5.1 km)
- Paynes Prairie Preserve State Park (south) (5.4 km)
- Earl P. Powers Park (6.5 km)
Frequency is the share of complete checklists at this location that listed the bird, 2016–2025. Busy places report more of everything, and the weekly chart counts species on at least 5% of checklists so a few stray reports do not inflate it. How to read it.