Birding spot · Suffolk County, New York
Birding at Timber Point State Tidal Wetland: What You'll See Each Week
In November, the birds most often reported at Timber Point State Tidal Wetland are Osprey (82%), Great Egret (77%), and Red-winged Blackbird (76%). It is busiest in summer, when 57 species turn up on at least 1 in 20 checklists, and species counts peak in the second week of June (63 species). 153 species have been reported here across 1,645 complete checklists from 290 birders.
Species by week
In November: what to expect
- 1
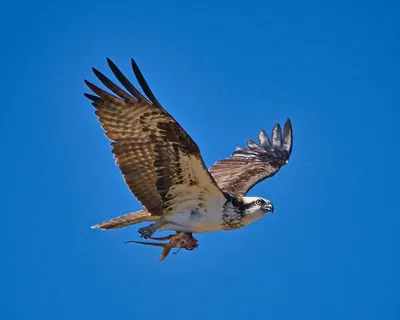 Osprey82%
- 2
 Great Egret77%
- 3
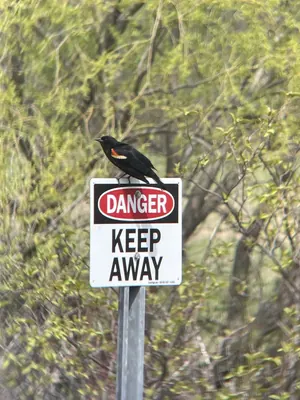 Red-winged Blackbird76%
- 4
 American Herring Gull69%
- 5
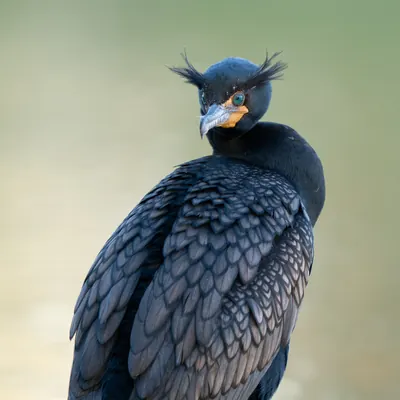 Double-crested Cormorant67%
- 6
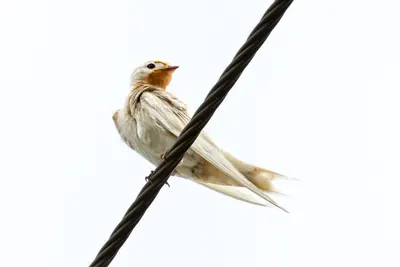 Barn Swallow63%
- 7
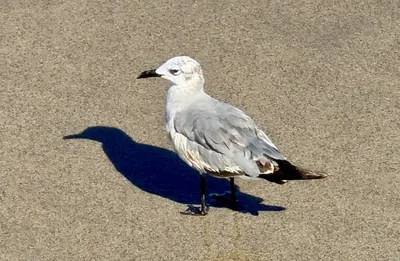 Laughing Gull61%
- 8
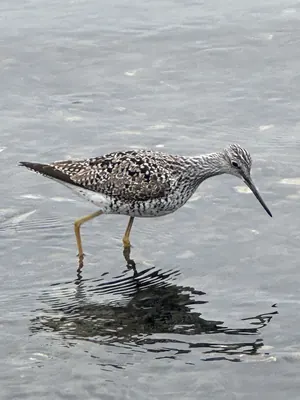 Greater Yellowlegs59%
- 9
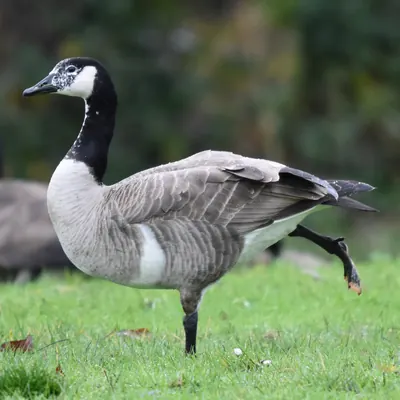 Canada Goose56%
- 10
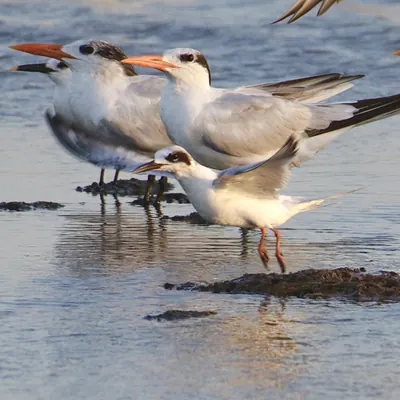 Forster's Tern56%
- 11
 Snowy Egret54%
- 12
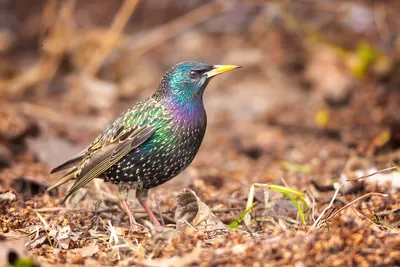 European Starling52%
- 13
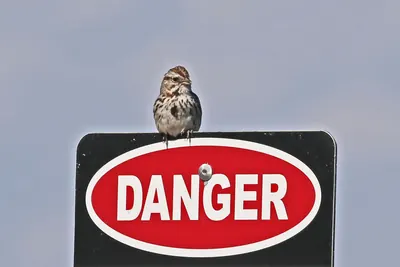 Song Sparrow48%
- 14
 Mallard48%
- 15
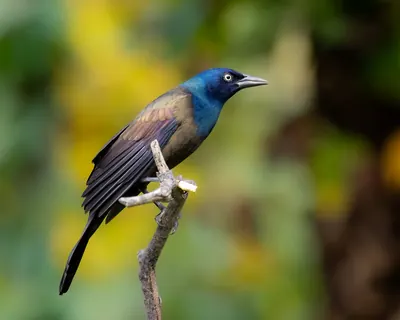 Common Grackle45%
Share of complete checklists at this spot that reported the bird in November. The sparkline is the whole year, with this month highlighted.
Season by season
Winter 41 species
Spring 53 species
- Red-winged Blackbird88%
- Osprey88%
- Canada Goose82%
- Great Egret79%
- Mallard64%
Summer 57 species
Fall 55 species
Specialties
Birds reported far more often here than across New York.
- Seaside Sparrow
- Saltmarsh Sparrow
- Clapper Rail
- Forster's Tern
- Willet
- Boat-tailed Grackle
- Glossy Ibis
- Snowy Egret
Nearby spots
- Heckscher State Park (2.2 km)
- Bayard Cutting Arboretum State Park (2.5 km)
- Connetquot River State Park Preserve (5.7 km)
- COUNTY of SUFFOLK Land (11.6 km)
- Captree State Park (13.1 km)
- County of Suffolk Land (New Millpond) (14.4 km)
Frequency is the share of complete checklists at this location that listed the bird, 2016–2025. Busy places report more of everything, and the weekly chart counts species on at least 5% of checklists so a few stray reports do not inflate it. How to read it.